Normally when people in New Orleans ask if an area floods they are talking about heavy rains causing water to pool in the streets until the city pumps can suck the water down the drains and into the Mississippi River, but since Hurricane Katrina caused the levees to fail and flood the city with water from Lake Pontchartrain, people now include the risk of levees failing when discussing flooding and debate whether the $14 billion dollar new levee system will save us all. This article explains the various flood zones and provides step-by-step guidance on how to read a flood map and create your own flood map for any location.
Protecting residents from the financial loss due to flooding, no matter whether it is from heavy rains or levee breaches, dates back to 1968 when Congress created the National Flood Insurance Program, giving the responsibility to the Federal Emergency Management Agency (FEMA) for producing Flood Insurance Rate Maps that show areas subject to flooding based on historic, meteorological and hydrologic data.

The Flood Map provides information that allows you to identify not only Special Flood Hazard Areas but the Base Flood Elevation at a specific site, as well as areas of undeveloped coastal barriers where flood insurance is not available.
Flood Maps provide a wealth of information, including:

A 100-year flood is not a flood that occurs every 100 years, but one that has a 26 percent chance of occurring during a 30-year period, the length of many mortgages. The 100-year flood is a regulatory standard used by Federal agencies and most states, to administer floodplain management programs, and is used by the National Flood Insurance Program (NFIP) as the basis for insurance requirements nationwide. Special Flood Hazard Areas (SFHA) are those areas having at least a 1 percent chance of flooding during any one year. Flood Maps are easy to get and are found online at FEMA's Map Service Center.
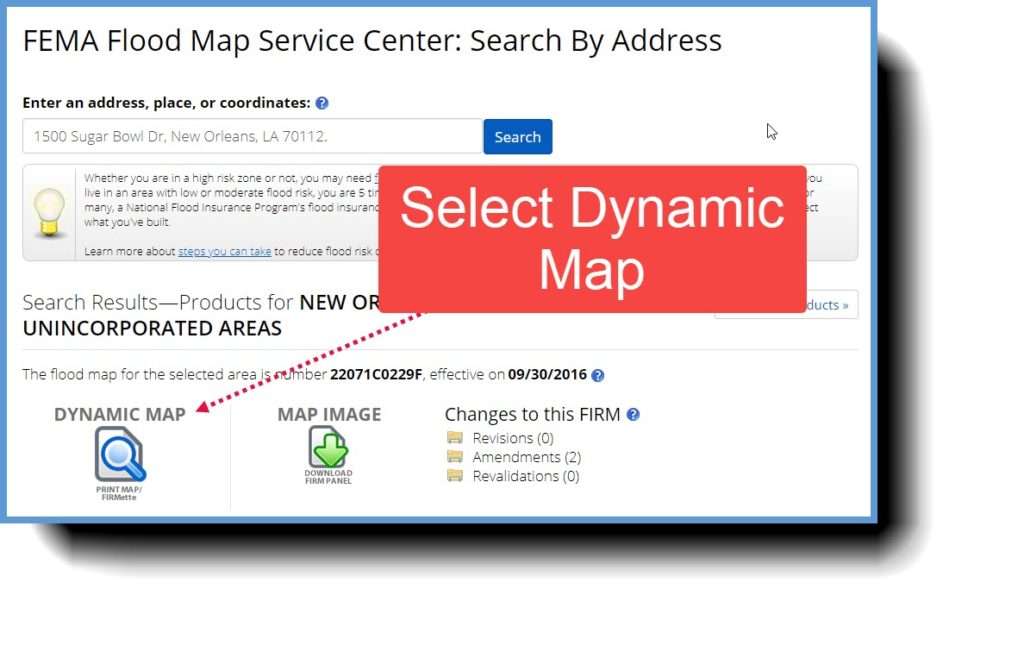
Let's say we want flood zoning information on the Mercedes Benz Superdome in New Orleans, so we enter the address: 1500 Sugar Bowl Dr, New Orleans, LA 70112.

Next, you can select from two options: 1) a Dynamic Map or 2) a Map Image. The easiest is to select the Dynamic Map.
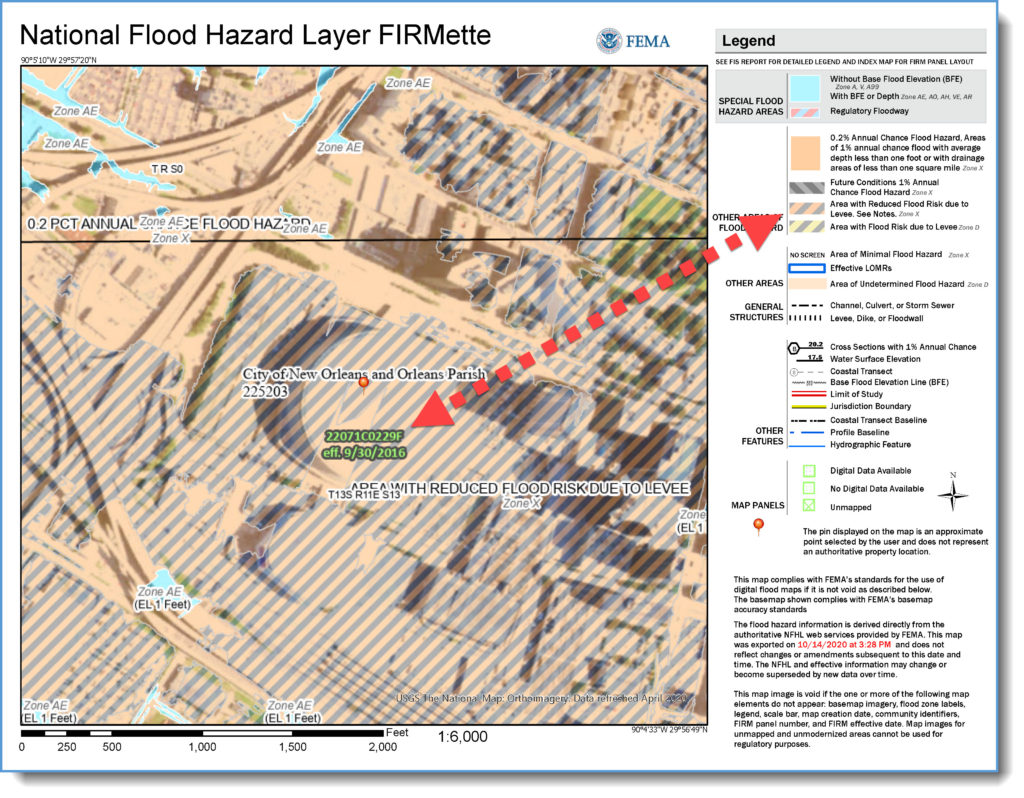
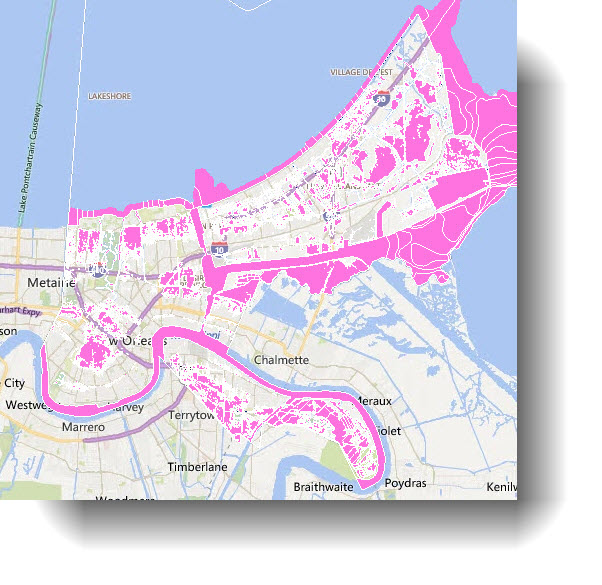
Next, match the color pattern in your flood map to the legend. This legend shows the Superdome is in flood zone X, a minimal risk area. However, the area just across Poydras Street is flood zone AE, a high risk area.
The map is dated 9/30/2016 and each map has a number, called a panel. This map is panel 22071C0229F.
In addition to selecting a dynamic map, you can select to download the map image of a FIRM Panel. This produces a zip folder with 3 files, a pdf read me, a tif image and a tfw file which allows the image to be viewed in a GIS application.

The tif formatted image can be a higher resolution showing more detail but the file size is 10 times larger which causes download problems.

Zone A: This zone has a low risk of erosion and can experience breaking waves less than 1.5 feet. No base flood elevations are calculated.
Coastal Zone A: This zone is subject to erosion, fast and strong water movement, and wave heights of 1.5 to 3 feet during storm events. Base flood elevations are calculated for these zones and displayed on flood maps. Communities have the option of adopting more stringent building codes (up to V Zone standards) in this zone, which would give them points in the Community Rating System. This zone is relatively new, so it may not be applicable to your community’s current flood maps. On the new maps, the landward edge of the zone is marked by the LiMWA line (Line of Moderate Wave Action). An elevation certificate is required to accurately calculate insurance rates in this zone.
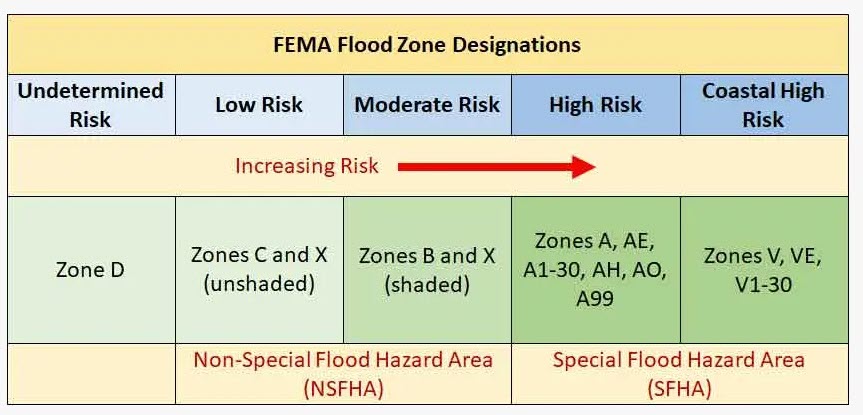
These zones make up the Special Flood Hazard Area and are in the 100-year-flood zone. They have at least a 1% chance of flooding each year and at least a 26% chance of flooding over the lifetime of a 30-year mortgage. Structures located in these zones with a federally-backed mortgage are required to purchase flood insurance. On a flood map these zones are referred to as the letters below or, collectively, as the 1% annual chance or 100-year-flood zone.
Zone AE or Zone A1-30: This zone has a low risk of erosion and can experience breaking waves less than 1.5 feet. Base flood elevations are calculated and displayed on flood maps. AE zones are present on newer maps; zones A1-30 are present on older maps. An elevation certificate is required to accurately calculate insurance rates in these zones.
Zones AH, AO, AR, A99: The flood insurance rate zone that corresponds to areas of the 100-year floodplains that will be protected by a Federal flood protection system where construction has reached specified statutory milestones. No Base Flood Elevations or depths are shown within this zone. Mandatory flood insurance purchase requirements apply.
Zone V: This zone faces an additional hazard from erosion, fast and strong water movement, and waves that may be 3 feet or greater during storm events.
Zone VE or V1-V30: These zones face an additional hazard from storm waves, and can experience waves greater than 3 feet. Base flood elevations are calculated for these zones and displayed on flood maps. VE zones are present on newer maps; zones V1-30 are present on older maps. An elevation certificate is required to accurately calculate insurance rates in these zones.
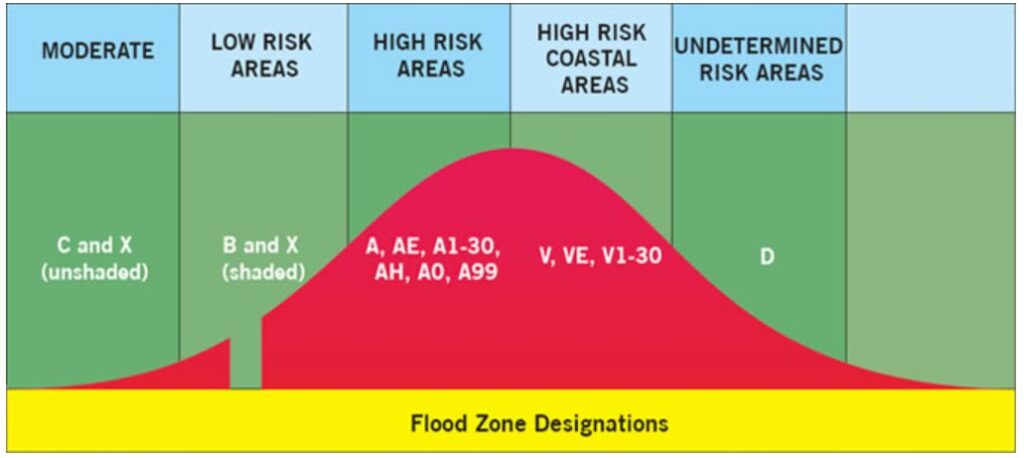
Zone X (shaded) and Zone B: The area between the extent of the 100-year-flood (1% annual chance flood) and the 500-year-flood (0.2% annual chance flood). There is no base flood elevation calculated for these zones, so elevation certificates are not necessary. Flood insurance could be much cheaper in these zones because of the lower risk. These areas are not subject to the mandatory purchase of flood insurance.
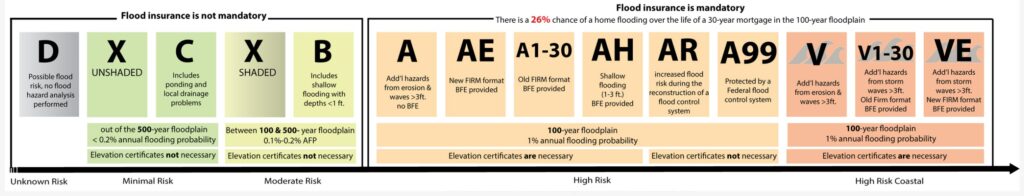
Zone X (unshaded) and Zone C: The area outside of the extent of the 500-year-flood with minimal flood risk. If a structure is located in this zone, however, it does not mean that it is out of harm’s way. The risk determination is based on probability, and the probability of a flood reaching this area is low, but it is not impossible. There is no base flood elevation calculated for these zones, so elevation certificates are not necessary. Flood insurance could be as much as 50% cheaper in these zones because of the lower risk. These areas are not subject to the mandatory purchase of flood insurance.

Zone D: Areas classified as Zone D have not had a flood hazard analysis performed. These are often areas with very low population counts.
This is the boundary of the flood that has a 1-percent chance of being equaled or exceeded in any given year. Also known as the 100-year floodplain.
The height, in relation to the National Geodetic Vertical Datum of 1929 (or other datum, where specified), of the flood having a 1-percent chance of being equaled or exceeded in any given flood year (also known as the 100-year flood or the base flood).
The flood having a 1-percent chance of being equaled or exceeded in any given year; also known as the base flood. The 1-percent annual chance flood, which is the standard used by most Federal and state agencies, is used by the National Flood Insurance Program (NFIP) as the standard for floodplain management and to determine the need for flood insurance. A structure located within a special flood hazard area shown on an NFIP map has a 26 percent chance of suffering flood damage during the term of a 30-year mortgage.
This is the boundary of the flood that has a 1-percent chance of being equaled or exceeded in any given year. Officially termed the 1-percent annual chance floodplain.
This is the boundary of the flood that has a 0.2-percent chance of being equaled or exceeded in any given year. Officially termed the 0.2-percent annual chance floodplain.
The height of the base flood, usually in feet, in relation to the National Geodetic Vertical Datum of 1929, the North American Vertical Datum of 1988, or other datum referenced in the Flood Insurance Study report, or depth of the base flood, usually in feet, above the ground surface.
A fixed starting point of a scale.
An independent agency of the Federal government, founded in 1979, which reports directly to the President. FEMA is responsible for identifying and mitigating natural and man-made hazards. The agency's mission is: to reduce loss of life and property and protect our nation's critical infrastructure from all types of hazards through a comprehensive, risk- based, emergency management program of mitigation, preparedness, response and recovery.
A general and temporary condition of partial or complete inundation of normally dry land areas. For flood insurance claim purposes, two or more structures must be inundated before flood damage will be covered.
A pre-Map Initiatives floodplain management map that delineates the 100-year (1% annual chance) and 500-year (0.2% annual chance) floodplains, floodway, and cross sections.
A map on which the 100-year (1% annual chance) and 500-year (0.2% annual chance) floodplains, Base Flood Elevations, and risk premium zones (and floodway information on Map Initiatives FIRMs) are delineated to enable insurance agents to issue accurate flood insurance policies to homeowners in communities participating in the National Flood Insurance Program.
Area inundated by the base (1-percent annual chance) flood, identified on the Flood Insurance Rate Map as Zones A, AE, AH, AO, AR, V, VE, or A99.
The height, in relation to the National Geodetic Vertical Datum of 1929 (or other datum, where specified) of floods of various magnitudes and frequencies in the identified floodplains of coastal or riverine areas.