If you are looking for industrial zoned property in Orleans Parish, there are only five areas from which to choose. That's because every one of the industrial zoned areas is near a railroad, a byproduct of 300 years of development in New Orleans.
New Orleans was founded in 1718 and development was fueled by sugar and coffee trading and transportation as the gateway to the Mississippi River. From 1830 to 1840 it became the wealthiest and third most populous city in the nation. The Ponchartrain Railroad was built in 1830 and was one of the earliest in the United States. In 1851 the New Orleans & Jackson Railway north was completed. In 1854 the Southern Pacific west was completed. This convergence of railroads helped spur the growth and caused the development of nearby warehouses to house goods for transport, resulting in five industrial zoning areas.
The Tchoupitoulas area is a five mile strip from Audubon Zoo to the Jackson Street Wharf along Tchoupitoulas Street. Goods are trucked from cargo ships docked at the Nashville Avenue, Henry Clay and Louisiana Street wharves. Shown in the zoning map as sections A-15, B-15 and C-15.
Stretching from the downtown area along the current AMTRAK path, this industrial sector continues along Earhart Boulevard to the Carrollton area. Spots in this area have been rezoned for a wide variety of uses, such as multi-family to accommodate the change in demand for affordable housing after Hurricane Katrina in 2005, retail for the 100,000sf Restaurant Depot serving the booming New Orleans hospitality industry, and new warehouses for Mardi Gras floats. Shown in the zoning map as sections B-13, C-13 and C-14.
The strip from the Mid-City area stretches from South Claiborne Avenue to Carrollton along Conti and St. Louis and Lafitte Streets, and includes an area behind the current Home Depot facing South Carrollton which previously was a roundhouse, allowing a locomotive to change tracks. Shown in zoning map as sections C-12 and C-13.
Starting from the Louisa Street wharf at the Mississippi River, this industrial sector runs north along Press Drive and intersects Franklin Avenue at Almonaster then runs west along Florida Avenue to Gentilly Boulevard near Dilliard University. Shown on zoning map as sections D-12, E-12, D-13.
Starting at the Poland Street Wharf, the largest industrial zoned area stretches for 15 miles, first north along the Industrial Canal to Interstate 10, then east along Chef Menteur and Almonaster Boulevard, encompassing the largest section of railroad track in New Orleans. This area includes the NASA Michoud Assembly Center and landfill areas with large tracks of land along Old Gentilly Road. Shown on zoning map as sections E-14, E-13, E-12, F-12, F-13, G-12, G13, H-12 to H14, I-12 to I-14, J-12-J-13, K-12, L-11, L-12 and stops at the swamps in the Bayou Savage National Wildlife Refuge.
Sources:
www.lousianacommercialrealty.com
New Orleans City Planning Commission
New Orleans is one of only 37 cities in the world approved by the London Metals Exchange to store inventory, which makes owning one of the 600 approved warehouses a good way to take advantage of a market with limited supply and constant demand.
About the London Metals Exchange
Vast quantities of metals are traded at the London Metals Exchange, where buyers and sellers of metals either speculate or just protect their business from rapid price changes. In 2011, the exchange traded 146.6 million lots, equivalent to $15.4 trillion annually and $61 billion on an average business day. The Exchange provides a forum for all trading activity and as a result helps to 'discover' what the price of material will be months and years ahead. This helps any business using these metals to plan forward in a world subject to severe and rapid price movements.
The London Metals Exchange offers a range of futures and options contracts for non-ferrous, minor metals and steel, including:
Contract |
Lot Size |
|
| Aluminum | 25 tons | |
| Aluminum Alloy | 20 tons | |
| Copper | 25 tons | |
| Lead | 25 tons | |
| Nickel | 6 tons | |
| Tin | 5 tons | |
| Steel Billet | 65 tons | |
| Molybdenum | 6 tons | |
| Cobalt | 1 ton |
Source. www.lme.com
Delivery against London Metals Exchange contracts is in the form of warrants, which are bearer documents of title enabling the holder to take possession of a specified parcel of metal at a specified London Metals Exchange approved warehouse. Each London Metals Exchange warrant is for one lot of metal, the tonnage of which is dependent on the contract specification. The front of the London Metals Exchange warrant displays information about the parcel of metal, including its brand, the exact tonnage, the shape and the location. Warrant holders are responsible for payment for storage of material.
Warrants are issued by the warehouse companies at the request of the owner of the metal once it is properly stored in a London Metals Exchange approved warehouse and the warehouse company has ensured conformity with the Special Contract Rules for that metal. These rules include, but are not limited to, the technical specification of the metal, its shape, weight and bundling.
Ultimately, only a relatively small percentage of London Metals Exchange contracts actually result in delivery, as the vast majority of contracts prove to be hedging contracts bought or sold back before falling due for settlement. As a result, the deliveries that do take place, either in or out of warehouse, will reflect the physical market demand and supply, and the information included in the London Metals Exchange’s daily stock reports can play a major part in the market’s assessment of the world’s metals prices.
London Metals Exchange Approved Warehouses
The London Metals Exchange does not own or operate warehouses and nor does it own the material they contain, but authorizes warehouse companies and the warehouses they operate to store approved brands on behalf of warrant holders. Warehouse companies may issue warrants, through their London agent, for material delivered into their approved warehouses. The exchange approves and licenses a network of warehouses and storage facilities around the world which must meet strict criteria before they are approved for the handling of metals. The network is meant to even out swings in volatile metals markets, because during recessions, surplus metal can be stored until economies recover, and when demand picks up the metal can be released.
More than 450 brands of material from over 60 countries are approved as ‘good delivery’ against contracts, and material stored in warehouses must be of an approved producer, such as Freeport McMoran Copper & Gold, conforming to the specifications covering quality, shape and weight as defined by the special contract rules of the London Metals Exchange. London Metals Exchange will only accept applications for the listing of approved warehouses from approved warehouse companies, and inspection of premises offered for warehousing occurs prior to any listing.
60 of the 600 warehouses approved by the London Metals Exchange, which amounts to 10% of the world supply, are based in New Orleans and are listed below:
| 410 Josephine Street |
| Warehouse 6 |
| Warehouse 1 |
| 1009B McDermott Road |
| 1009C McDermott Road |
| Compound France Road |
| 5630 Douglas Street |
| 500 Louisiana Avenue |
| 1930 Japonica Street |
| 2601 Decatur Street |
| 2520 Decatur Street |
| 5300 Old Gentilly Road |
| 600 Market Street |
| 5632 Douglas Street |
| 561 Bonita Drive |
| 700 Edwards Avenue |
| 4501 North Galvez Street |
| 1560 Tchoupitoulas Street |
| 4300 Jourdan Road |
| 13601 Old Gentilly Road |
| 3501 Jourdan Road |
| 6101 Terminal Drive |
| Nashville Yard B |
| Warehouse B |
| Warehouse C |
| 5301 Jefferson Highway |
| 600 Edwards Avenue |
| Arabi Compound |
| Warehouse Arabi 1 |
| 5501 Jefferson Highway |
| 3720 Robertson Street |
| 5601 France Road |
| 4150 Michoud Boulevard |
| 4200 Michoud Boulevard |
| 1770 Tchoupitoulas Street |
| 4400 Florida Avenue |
| 402 Alabo Street Yard |
| Warehouse 500 Edwards |
| 808 Dakin Street |
| 1000 Dakin Street |
| Warehouse 4 |
| 600 St George Avenue |
| 1 Alabo Street Wharf |
| 5050 Almonaster Avenue |
| 6040 Beven Street |
| 1000 Edwards Avenue |
| Warehouse 5 |
| 440 Josephine Street |
| 5725 Powell Street |
| 5042 Bloomfield Street |
| 325 Hord Street |
| 1645 Tchoupitoulas Street |
| 1601 Tchoupitoulas Street |
| Warehouse 1A |
| 2940 Royal Street |
| 601 Market Street |
| Warehouse 2 |
| Warehouse 19 |
Source. www.lme.com
London Metals Exchange Policy For Warehouses
There are 14 requirements for approved warehouses:
1. Road connection to major highways is mandatory.
2. Rail loading facilities adjacent to the warehouses will be required if, in the opinion of the London Metals Exchange, this service is routinely required by the metals trade. Warehouses without direct rail connections in such locations may be considered for listing if it can be demonstrated that adequate shuttle services to the rail head are provided by the warehouse company at its own cost and risk.
3. Water loading facilities adjacent to the warehouse or otherwise will be treated in the same way as rail.
4. For each 2500m2 of space there must be access by means of an operational door for vehicle loading/unloading, with a minimum of 2 doors per warehouse.
5. The minimum daily delivery tonnage must be in accordance with the table below. Where the delivery requests exceed the minimum daily delivery tonnage for the capacity on the table below, the London Metals Exchange will regard the standard as applying over the number of days necessary to complete the deliveries, as per the table (e.g. if the requests for the delivery of 2000 tons apply to a warehouse’s location capacity of 2500 sq. meters, the standard would be to deliver in 3 days with no reference to the performance on any one of those days). The London Metals Exchange would, however, expect the warehouse company to act reasonably when allocating the tonnage delivered out in each of those days. The daily delivery tonnage is for deliveries out only and does not include deliveries in.
Warehouse Company’s Authorized Space Per Location, In M2 |
Minimum Daily Delivery Tonnage For All Metals |
| 2,500 | 800 tons |
| 5,000 | 1,200 tons |
| 7,500 | 1,500 tons |
Source. www.lme.com
6. The London Metals Exchange recognizes that it may not be possible to achieve exactly the same delivery rates if delivery into containers, vans or railcars is required. In assessing a warehouse company’s performance, the circumstances will be taken into account.
7. Once all formalities permitting delivery have been completed the warehouse shall prioritize all requests for deliveries out on the basis of 48 hours’ notice and strictly in the order in which they are received, unless the Warrant holders seeking cancellation agree otherwise.
8. In addition to their rent and FOT (free on truck) charges, warehouse companies are also required to supply the London Metals Exchange with a comprehensive set of charges for delivery out of warranted metal and will undertake to immediately advise the London Metals Exchange of any changes. Warehouse companies are also required to submit to the London Metals Exchange compulsory port tariffs for the import and export of metal.
9. There should be no charges above the FOT for returning the metal to the warehouse companies approved and nominated loading berths within the location where the London Metals Exchange discerns a need for such transportation; the unloading of such metal from the truck being for the receiver’s account.
10. Similarly there should be no charges above the FOT for returning metal to the nearest railhead where the London Metals Exchange discerns a need for such transportation. With the exception of the FOT charge and port tariffs for the export of metal the warehouse company may not impose any compulsory additional charges when delivering metal out.
11. In the event that an existing approved warehouse/warehouse company does not appear to meet the London Metals Exchange criteria, there will be an initial consultation with the warehouse company concerned.
12. If the warehouse company can demonstrate that it will upgrade facilities or work practices to meet the London Metals Exchange’s new standards, the London Metals Exchange will consider the appropriate amount of time to allow for such a process. Warehouses could, for example, be given 6-12 months to upgrade their facilities or relocate to a more suitable building within the location, but this would be determined on a case by case basis, according to the circumstances.
13. If after consultation the warehouse company is unwilling or unable to upgrade its facilities or work practices to meet London Metals Exchange standards, the exchange retains the right to restrict the capacity of that warehouse company in that location or even delist it.
14. Prior to implementation, the London Metals Exchange would give the necessary notice of any action to be taken to the warehouse company and allow for formal representations to be made.
Rates the owner of LME warranted metal will payto the listed warehouse company to store their metal-Per Ton Per Day In US Cents |
||||||||
| Warehouse Company | Copper | Lead | NASAAC | Nickel | Primary Aluminum | Tin | Zinc | Steel |
| CWT Commodities (USA) LLC | 41 | 41 | 46 | 49 | 45 | 46 | 42 | / |
| Henry Bath LLC | 39 | 37 | 43 | 48 | 43 | 43 | 39 | 35 |
| Metro International Trade Services LLC | 41 | 41 | 46 | 49 | 45 | 46 | 42 | 39 |
| NEMS (USA) Inc | 41 | 41 | 46 | 49 | 45 | 46 | 42 | 40 |
| Pacorini Metals USA LLC | 41 | 41 | 46 | 49 | 45 | 46 | 42 | 40 |
| Worldwide Warehouse Solutions LLC | 41 | 41 | 46 | 49 | 45 | 46 | 42 | / |
Warehouse Takeovers
London Metals Exchange rules stipulate that warehouses must deliver a certain amount of metal each day. However the rules apply not to each warehouse but to each city that a company has warehouses in. At the moment, a warehouse operator needs to deliver just 1,500 tons a day per city, whether it owns one warehouse or dozens. In Detroit, that means each warehouse needs to release only 79 tons of aluminum a day. At that rate, it would take two years to clear the stocks held by Goldman's Detroit warehouses.
The backlog sparked outrage last year, prompting the London Metals Exchange to task London-based consultancy Europe Economics to look into its rules. Starting in April, 2012, the minimum delivery rate will double to 3,000 tons a day.
The cash flow of the business has led to a wave of takeovers. Three of the four largest warehouse operators were bought by Goldman, JPMorgan and Baar, Switzerland-based Glencore International Plc in 2010. Metro International added at least 17 warehouses since it was bought by Goldman in February 2010,and JPMorgan took control of Henry Bath & Son Ltd. in July 2010 as part its $1.7 billion acquisition of units of RBS Sempra Commodities.
Glencore, the largest listed commodity trader, said it agreed to buy Pacorini Metals in August 2010 and Hong Kong-based Noble Group Ltd. (NOBL) acquired Delivery Network International LLC the following month. Trafigura Beheer BV, based in Amsterdam, said it bought North European Marine Services Ltd. in March 2010.
Sources:
www.bloomberg.com
www.reuters.com
www.LondonMetalsExchange.com
Forbes
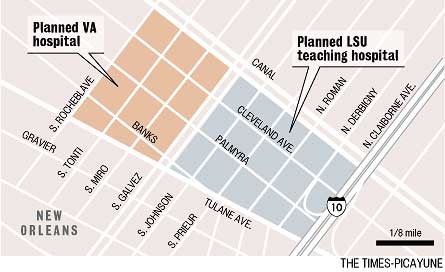
![]() Even though there is much anticipation of spin-off commercial real estate development surrounding the new Veterans Administration and LSU hospitals on Tulane Avenue in New Orleans, there will be no doctor's clinics constructed, no medical offices and no lab testing facilities built to replace the vacant lots and blighted structures. This article details the hospital developments on Tulane Avenue and why the changing business model that hospitals have today eliminates the demand for commercial real estate development.
Even though there is much anticipation of spin-off commercial real estate development surrounding the new Veterans Administration and LSU hospitals on Tulane Avenue in New Orleans, there will be no doctor's clinics constructed, no medical offices and no lab testing facilities built to replace the vacant lots and blighted structures. This article details the hospital developments on Tulane Avenue and why the changing business model that hospitals have today eliminates the demand for commercial real estate development.
The Veterans’ Administration has agreed to rebuild its hospital facility adjacent to a new University Medical Center, which replaces Charity Hospital, and is operated by LSU. The VA’s new hospital, offering 200 beds is to be built between Tulane Avenue and Canal Street in the area bounded by South Galvez and South Rocheblave Streets, while the new LSU Hospital is expected to contain 424 beds. The LSU site fronts Tulane Avenue and Canal Street between South Galvez Street and South Claiborne Avenue, and is projected to open in 2015 with the VA facility to follow shortly thereafter. Both developments total $2.4 billion, making them the largest hospital developments in the United States.
The 30-acre campus for the Veterans Hospital will contain 1.7 million square feet -- about 70 percent larger than Charity Hospital -- with outpatient exam rooms, 200 hospital rooms, 20 intervention and surgery rooms, an emergency department, a research facility, rehabilitation services and a mental health division. The hospital is slated to employ 2,200 people with an average salary of $95,000 annually.
The new University Medical Center will replace the 68-year-old Medical Center of Louisiana at New Orleans, which closed following Hurricane Katrina. This new $1.2-billion facility will include a 560,000-square-foot, 424-bed inpatient tower, an adjoining 746,982-square-foot diagnostic and treatment pavilion, an adjacent 254,765-square-foot ambulatory care pavilion and support structures including a 546,413-square-foot, 1,346-car parking structure.
One of LSU's objectives is to build a brand and capture market share by treating heart and cancer patients who now are treated in Houston and other highly regarded specialty facilities out-of-state.
map street tulane avenue hospitals
With two large hospitals being developed, there is much anticipation by current property owners and speculators for additional developments to sprout up on Tulane Avenue, ranging from clinics so doctors can see their patients to laboratory and testing facilities. None of the developments will occur however, because the business model for hospitals has changed.
Hospitals now want control over their doctors. Dr. Steve Nelson, dean of LSU School of Medicine, noted in a recent speech that hospitals now conduct their business differently in their relationship to doctors who have rights to send patients to the hospital. One example is the clear absence of clinics and doctor's office surrounding Oschner Hospital on Jefferson Highway. There is no need for additional buildings to house a doctor clinic because that service will be provided on the hospital site. The new LSU Hospital will be a teaching hospital and academic medical center with doctor's clinics an on campus building; therefore, there will be no demand for any additional facilities on Tulane Avenue.
There will be a need for retail stores to satisfy demand for shopping, and for restaurants and hotels. However, there may not be demand for commercial real estate that results in a new Veterans Avenue. Both hospitals will house their own retail space including restaurants and stores for shopping.
Just because there is a new development doesn't mean there will be a flurry of shopping centers. Just look at the surrounding demand for shopping and restaurants around Ochsner's biggest campus on Jefferson Highway. There are only three nearby restaurants off campus: a Subway, a Dot's Diner, and a Piccadilly. In addition, a large proposed condo development never got off the ground, and a nearby shopping center failed to have enough demand to stay open.
There is hope for a new hotel in the Tulane Avenue area, but it will be on the hospital site. LSU is currently negotiating to develop a hotel on the campus to handle housing for families of patients. Speculation is whether there will be a need for condos and housing for all the new high income hospital employees. Where will they live? Same place they now live: in Uptown and old Metairie.
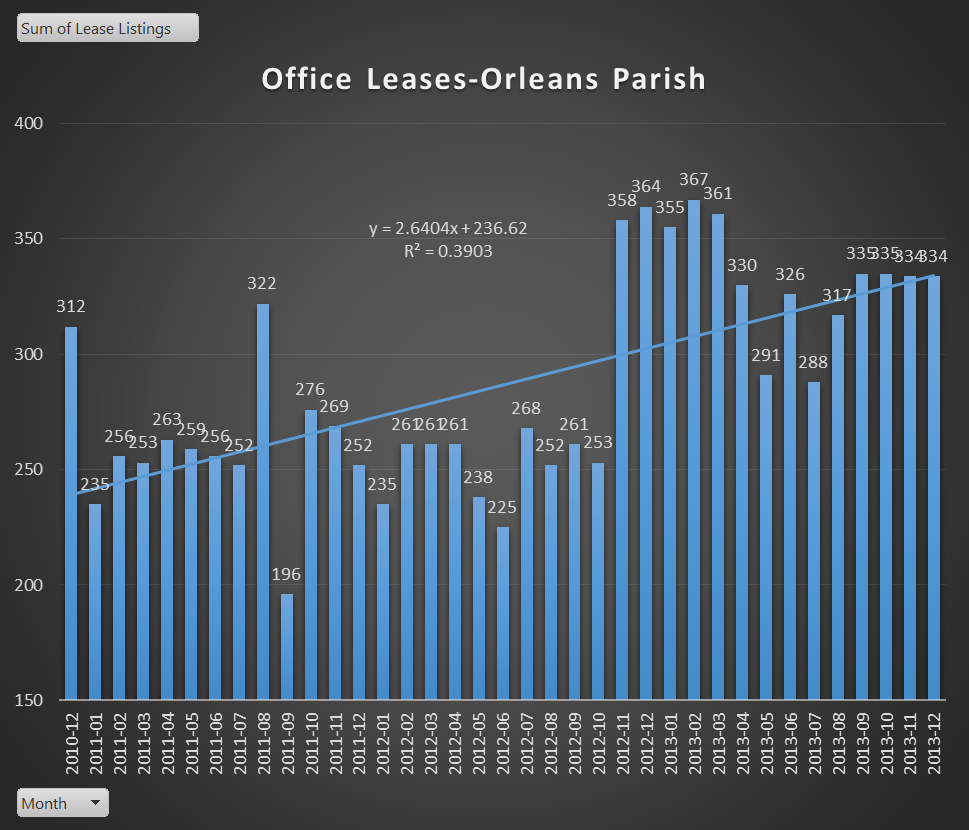
![]() The supply of office properties for lease in Orleans Parish has grown over 8.85% annually the last three years, with 1.9 million square feet in 286 properties averaging a lease of four properties per month at $15.62 per square foot. But that doesn't tell the whole story about the trend of the office market in Orleans Parish. By using pivot tables, we can drill down into the data and determine the real trend.
The supply of office properties for lease in Orleans Parish has grown over 8.85% annually the last three years, with 1.9 million square feet in 286 properties averaging a lease of four properties per month at $15.62 per square foot. But that doesn't tell the whole story about the trend of the office market in Orleans Parish. By using pivot tables, we can drill down into the data and determine the real trend.
The chart below shows the monthly number of properties available for lease since 2011 in Orleans Parish, with an increase in 2011 of an average of 261 properties to an average of 331 in 2013.
The chart below shows the trend in the number of properties leased. Even though the number of properties leased averages around 4 per month, the count skyrocketed in 2013 to 7 per month from around 3 per month in the previous years.

Chart Office Properties Leased Orleans Parish Since 2011
Prices of leased properties in Orleans Parish have risen steadily since 2011. Even though prices average $15.63 per square foot, since 2011 prices per square foot have increased 16.5%, or 5.51% annually, from $13.70/sf in 2011 to $15.97/sf in 2013.

Prices of Properties Leased -Orleans Parish Since 2011
The population of office properties for lease encompasses a variety of classes within Orleans Parish. The Building Owners & Managers Association uses the following definitions:
Class A-Most prestigious buildings competing for premier office users with rents above average for the area. Buildings have high quality standard finishes, state of the art systems, exceptional accessibility and a definite market presence.
Class B-Buildings competing for a wide range of users with rents in the average range for the area. Building finishes are fair to good for the area. Building finishes are fair to good for the area and systems are adequate, but the building does not compete with Class A at the same price.
Class C-Buildings competing for tenants requiring functional space at rents below the average for the area.
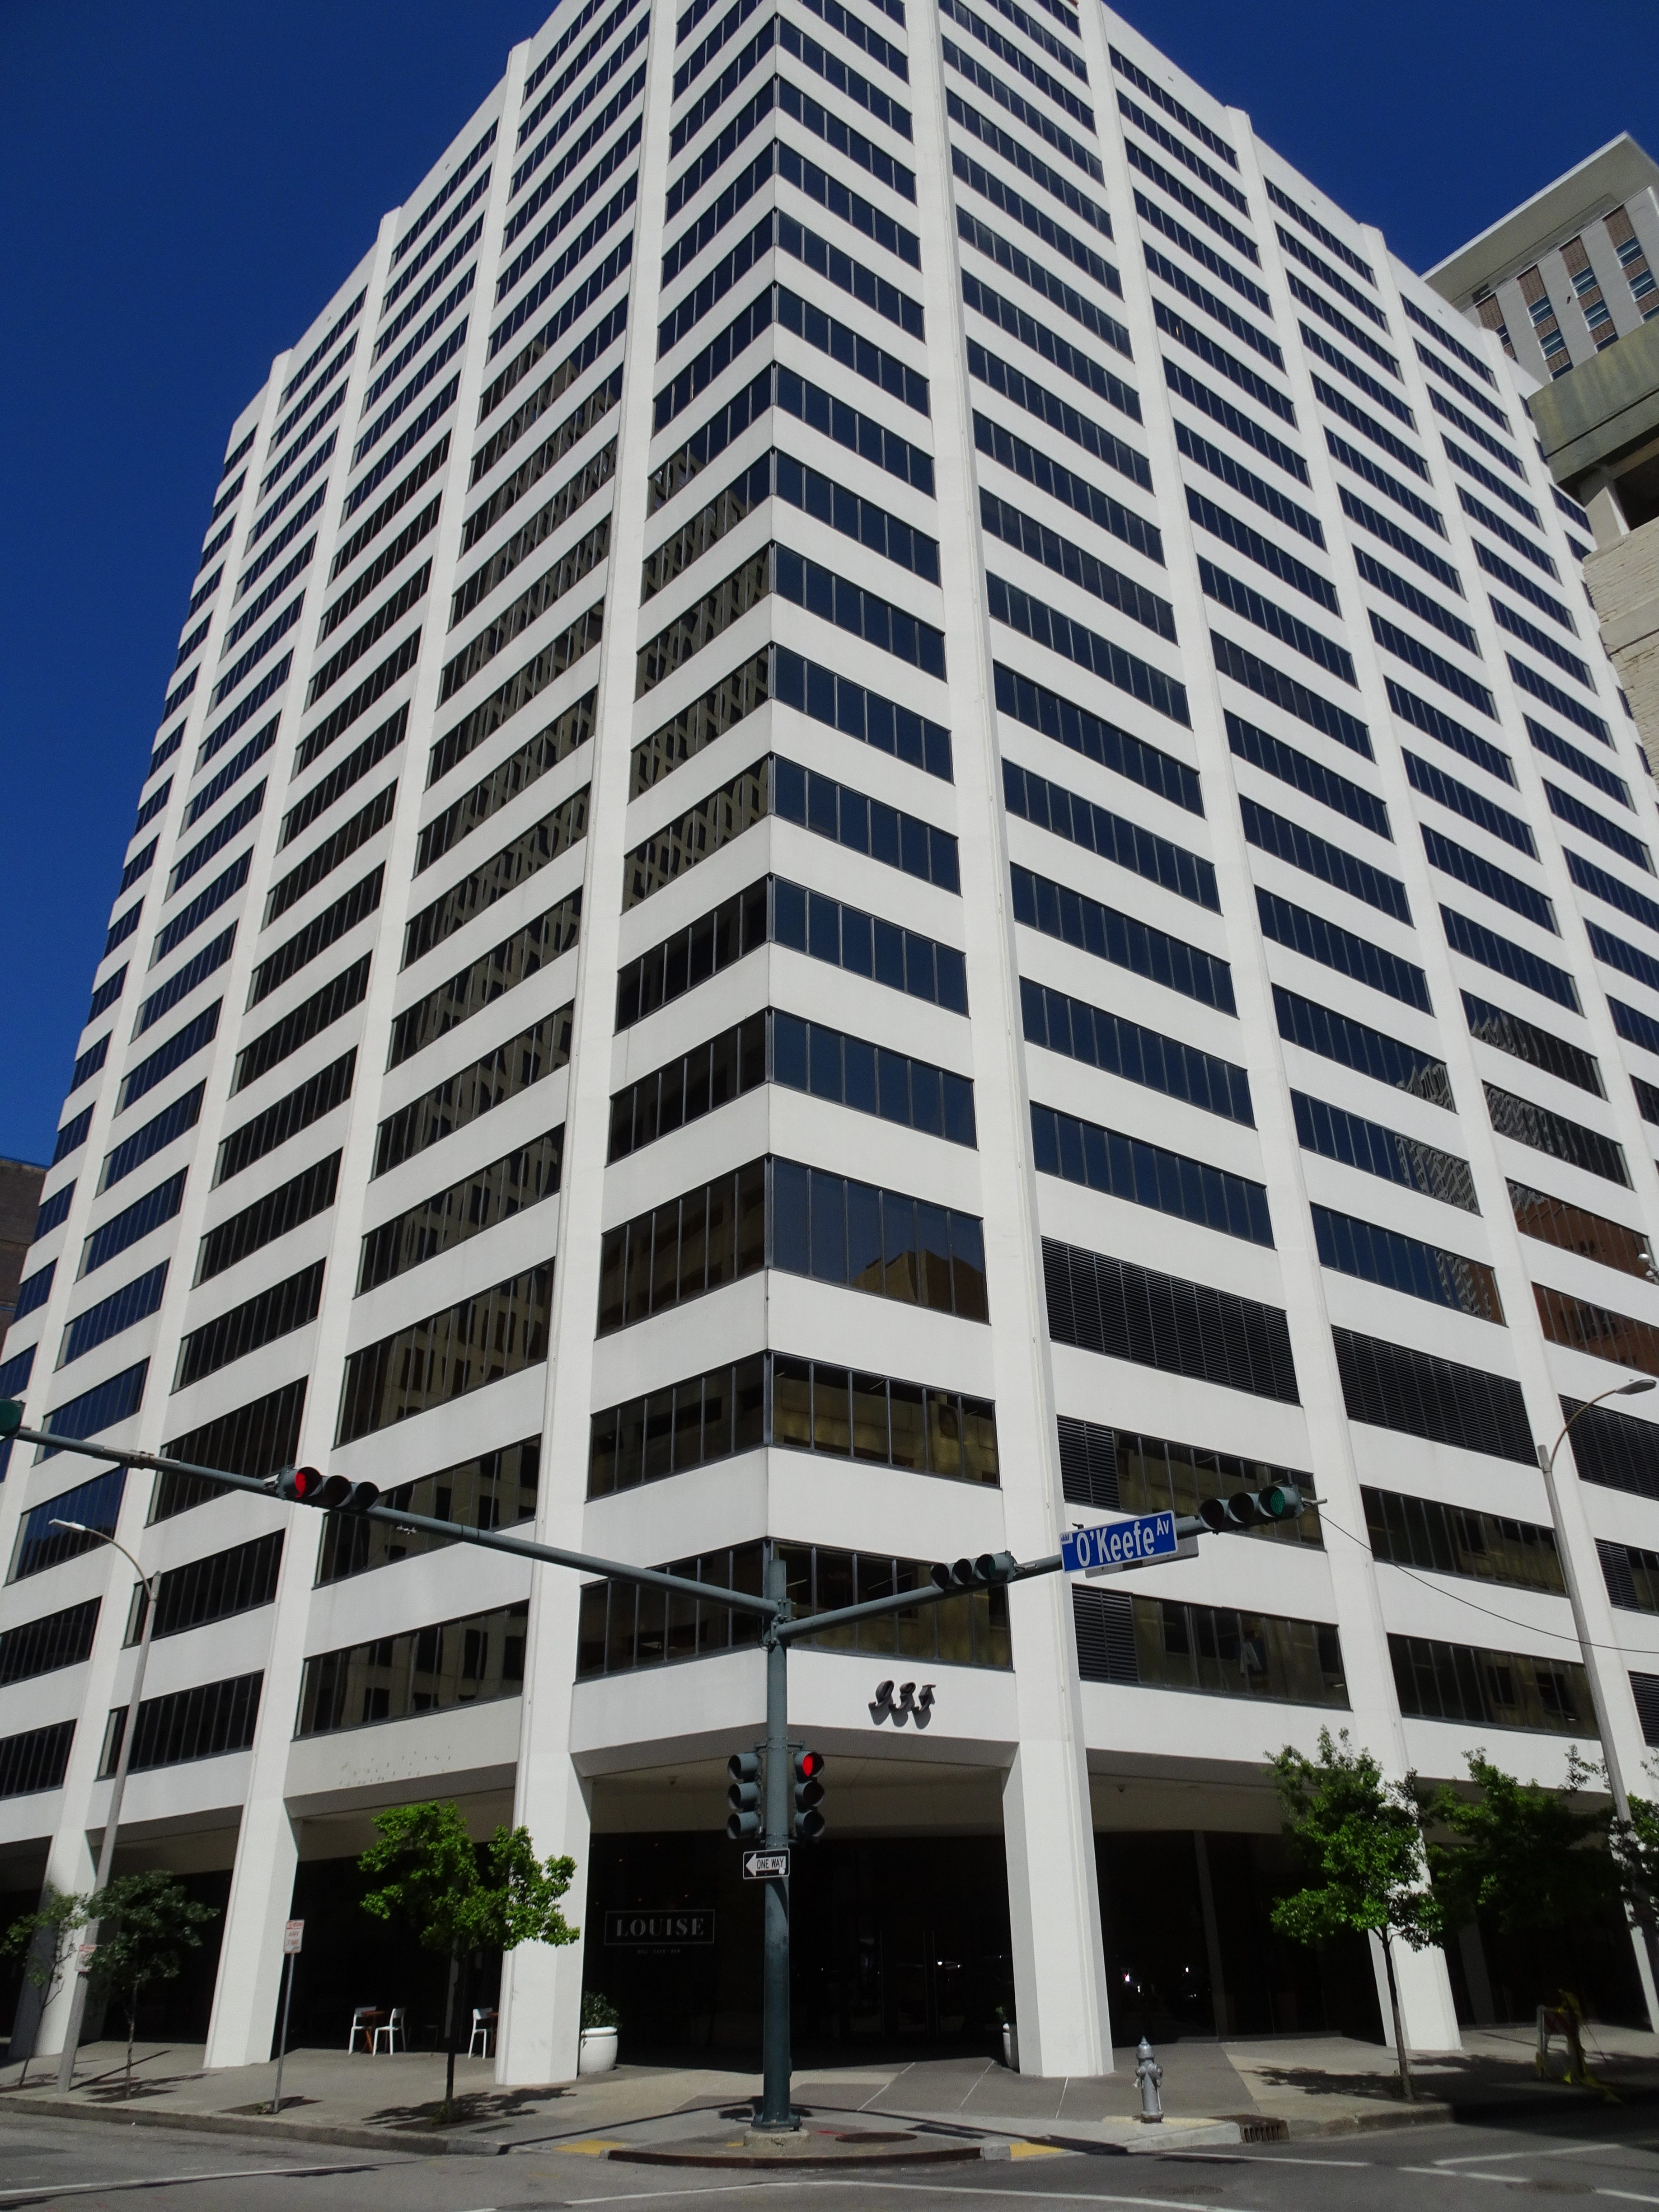
The highest quality office space, and the most expensive, is Class A office tower space in downtown New Orleans, which currently ranges from an asking price of $16.50/sf to $18.50/sf, with up to $30/sf in tenant improvement allowances for long term leases. The table below shows Class A office space for lease exceeding 17,000 square feet, which is usually one complete floor.

class a office space for lease
Comparing the lease market in New Orleans, which includes Orleans and Jefferson Parishes, to other markets such as the entire state, the metropolitan area, and Orleans Parish, the chart below shows a decline in prices the last 3 months in all areas, with the state of Louisiana averaging a list price on office space of $15.29/sf and the other areas ranging from $16.23/sf to $16.45/sf.
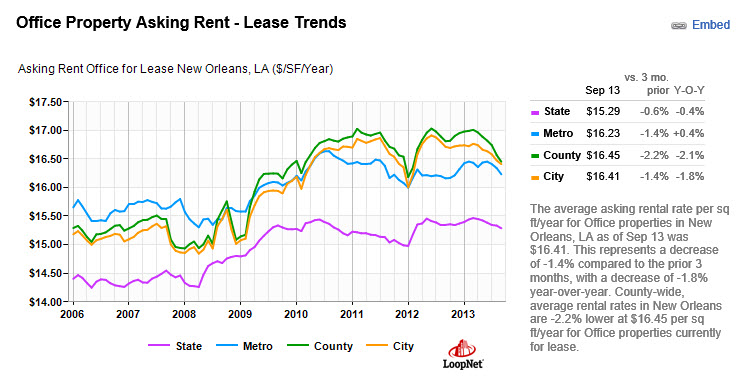
chart market trends
![]() Abutting the Lincoln Manor subdivision, near a shopping mall that Kenner officials hope will thrive, sits a 25-acre tract of commercial property that once was coveted by real estate developers but today looks more like a wildlife refuge. The Home Depot owns the undeveloped land, which is so badly overgrown that weed stalks, some taller than basketball goals, have completely swallowed a stop sign at 31st Street and California Avenue. The Home Depot's land once contained residential subdivisions, but the New Orleans Aviation Board bought out most of the homeowners in the 1990s, to help settle a lawsuit over noise and safety surrounding Louis Armstrong International Airport. The idea, as with all airport buyout property, was to put the land back into commerce.
Abutting the Lincoln Manor subdivision, near a shopping mall that Kenner officials hope will thrive, sits a 25-acre tract of commercial property that once was coveted by real estate developers but today looks more like a wildlife refuge. The Home Depot owns the undeveloped land, which is so badly overgrown that weed stalks, some taller than basketball goals, have completely swallowed a stop sign at 31st Street and California Avenue. The Home Depot's land once contained residential subdivisions, but the New Orleans Aviation Board bought out most of the homeowners in the 1990s, to help settle a lawsuit over noise and safety surrounding Louis Armstrong International Airport. The idea, as with all airport buyout property, was to put the land back into commerce.

25 acre site map near Williams and I-10
A spokeswoman for The Home Depot, Meghan Basinger, said the property is worth $25 million. The Home Depot is "aggressively marketing" it for sale and interest has been "steady," she added, but she would not say whether negotiations are currently underway. Yet the property is not listed on either the Louisiana Commercial Database or Loopnet, which are the "two databases where commercial agents list their land if they really want to sell," said Robert Hand, a Louisiana Commercial Realty broker who said he's not had any business with The Home Depot. "They are not reaching 99 percent of buyers," Hand said. "It is imperative that serious sellers have their properties in one of these two databases." The property is the largest of its kind on the market in Jefferson and Orleans parishes, according to Hand's compilation of non-industrial, commercial listings from the two databases. It's also by far the most expensive. The Home Depot's valuation of $1 million per acre, or $22.96 per square foot, is more than 50 percent greater than the highest asking price for the most-expensive non-industrial listing larger than 10 acres. That's a 15-acre site at Mounes Street and Dickory Avenue in Elmwood, going for $15 per square foot. Hand estimated The Home Depot's property could sell for $3 to $5 per square foot, and might take as long as five years to unload. Why would someone pay $25 million when they can get it for $4 million?" -- real estate broker Robert Hand. "There is just no demand for large developments in that area," Hand said. "Why would someone pay $25 million when they can get it for $4 million? The demographics don't warrant that much of a premium. Maybe in the French Quarter."
![]() Until this report, there has not been an analysis of the real estate agents and the appraisers in Louisiana. This report provides a snapshot of both industries and examines who is number one and where they do business.
Until this report, there has not been an analysis of the real estate agents and the appraisers in Louisiana. This report provides a snapshot of both industries and examines who is number one and where they do business.
There are 13,438 licensed real estate agents in Louisiana, but where they are located will surprise you. The location of real estate agents does not match up identically with the location of the home buying public. For example, New Orleans has the most licensed agents but does not have the highest population count unless you add in Metairie. Shreveport is the 3rd largest agent count in the state but has the 5th highest agent count. The table below compares the ranking of agent count to population.
Agent Ranking |
Population Ranking |
|
| 1 | New Orleans | BATON ROUGE |
| 2 | Baton Rouge | NEW ORLEANS |
| 3 | Shreveport | METAIRIE |
| 4 | Metairie | LAFAYETTE |
| 5 | Lafayette | SHREVEPORT |
| 6 | Lake Charles | MANDEVILLE |
| 7 | Kenner | SLIDELL |
| 8 | Bossier City | LAKE CHARLES |
| 9 | Monroe | COVINGTON |
| 10 | Alexandria | BOSSIER CITY |
| 11 | Houma | DENHAM SPRINGS |
| 12 | Marrero | KENNER |
| 13 | New Iberia | MONROE |
| 14 | Laplace | WEST MONROE |
| 15 | Slidell | ALEXANDRIA |
Ranking Louisiana cities by the ratio of real estate agent count to population shows that Baton Rouge and Lafayette have the lowest agent count ratios while Denham Springs, Kenner and Monroe have the highest ratios.

Chart Real Estate Count To Population
Agents must have their license held by a broker, as required by the Louisiana Real Estate Commission. The broker is held to a higher standard and requires 150 hours of classroom education in order to become licensed. There are 10,589 licensed brokers in Louisiana, located near the agent population, with New Orleans and Baton Rouge at 19% of the market. The top broker in the state is Latter and Blum with 1,163 agents, but they only have 8.6% of the market.
Table of Broker Count by City
| NEW ORLEANS | 1288 |
| BATON ROUGE | 1284 |
| METAIRIE | 700 |
| LAFAYETTE | 563 |
| SHREVEPORT | 497 |
| MANDEVILLE | 389 |
| SLIDELL | 321 |
| LAKE CHARLES | 261 |
| COVINGTON | 259 |
| DENHAM SPRINGS | 233 |
| BOSSIER CITY | 224 |
| KENNER | 204 |
Who Is The Number One Broker In Louisiana?
| LATTER & BLUM HOLDING, LLC | 1163 |
| GBS PROPERTIES, L.L.C. (Gardner) | 750 |
| RED STICK PARTNERS, L.L.C. | 206 |
| K.W.E.J., L.L.C. (Keller Williams) | 205 |
| J. WESLEY DOWLING & ASSOCIATES, L.L.C | 204 |
| TEC REALTORS, INC. | 191 |
| ACADIANA INVESTMENT GROUP, L.L.C. | 171 |
| REALTY EXECUTIVES SB LLC | 159 |
| H.O.D.C., L.L.C. | 138 |
| PELICAN REAL ESTATE & CONST., INC. | 129 |
| GROUP INTEGRITY, LLC | 122 |
| GROUP ONE REALTY, L.L.C. | 118 |
The broker market is not only fragmented but localized, with differences in agent count within areas just a few miles apart, as shown in the table below which compares the agent count by broker for New Orleans and Metairie.
| NEW ORLEANS TOTAL COUNT | 1288 | METAIRIE TOTAL COUNT | 700 |
| LATTER & BLUM HOLDING, LLC | 231 | GBS PROPERTIES, L.L.C. (Gardner) | 114 |
| GBS PROPERTIES, L.L.C. (Gardner) | 204 | K.W.E.J., L.L.C. (Keller Williams) | 85 |
| H.O.D.C., L.L.C. (Keller Williams) | 95 | SPECIALIZED REAL ESTATE SERVICES, INC. | 50 |
| TEC REALTORS, INC. | 42 | LATTER & BLUM HOLDING, LLC | 46 |
| K.W.E.J., L.L.C. (Keller Williams) | 40 | H.O.D.C., L.L.C. (Keller Williams) | 23 |
| P & M EQUITIES, INCORPORATED | 30 | REAL ESTATE PARTNERS, INC. | 22 |
| WILKINSON & JEANSONNE, L.L.C. | 22 | TEC REALTORS, INC. | 17 |
| DORIAN M. BENNETT, INC. | 21 | MARK O. RODI & ASSOCIATES, INC. | 14 |
| DOWN THE ROAD PARTNERS, LLC | 21 | REFERRAL ASSOCIATES OF LOUISIANA, INC. | 12 |
| LIMITED FUNCTION REFERRAL OFFICE, LLC | 21 | SRSA COMMERCIAL REAL ESTATE, INC. | 12 |
In the Metairie and New Orleans area combined, the top broker is actually GBS Properties, known as Gardner Realtors with 318 agents, compared to Latter and Blum with 277 agents.
There are 1,437 appraisers in Louisiana, broken into three licenses:
*Appraiser Trainees receive a license upon passing a test and completing 75 hours of training.
*Residential Appraisers receive a license upon passing a test and completing 3500 hours of training in no less than 2 years.
*General Appraisers receive a license upon passing a test and completing 5000 hours of training in no less than 3 years.
| General | 494 |
| Residential | 752 |
| Trainees | 191 |
| Total | 1437 |
Of the 494 Louisiana General Appraiser Licensees, 265 (53%) are in Louisiana, 18 are in Mississippi, and 43% are in 22 other states. Texas has 126, or 25% of the Louisiana General Appraiser Licensees, with 55 (43%) in Houston and 27 (21%) in Dallas.
| APR.CGA - Certified General Appraiser License | 494 |
| AL | 10 |
| AR | 10 |
| AZ | 3 |
| CA | 5 |
| CO | 2 |
| FL | 11 |
| GA | 14 |
| IL | 4 |
| KS | 3 |
| LA | 265 |
| ME | 1 |
| MI | 1 |
| MO | 6 |
| MS | 18 |
| MT | 1 |
| NC | 1 |
| NJ | 2 |
| NY | 1 |
| OH | 2 |
| SC | 2 |
| TN | 3 |
| TX | 126 |
| VA | 1 |
| WA | 1 |
| WI | 1 |
The Residential License count tells a different story. Of the 752 Residential Licensees, 93% are in Louisiana, and 97% are in Louisiana and Mississippi, with the remainder in 9 states.
| APR.CRA - Certified Residential Appraiser License | 752 |
| AL | 7 |
| CA | 4 |
| CT | 1 |
| FL | 2 |
| GA | 5 |
| LA | 701 |
| MS | 11 |
| SC | 1 |
| TN | 1 |
| TX | 16 |
| UT | 3 |
Where Are The Appraisers In Louisiana?
Metairie and New Orleans are home to 99 Residential Licensed Appraisers (14% of the state total), with Baton Rouge the 2nd largest market at 68 (9.7%) and Shreveport in 3rrd place at 43 (6.1%). General Licensed appraisers are mostly in the New Orleans/Metairie area with 53 (20% of the state total), followed closely by Baton Rouge at 47 (17.7%), with Lafayette in 3rd with 17 then Shreveport with 15.
| Certified General Appraiser License | 494 | Certified Residential Appraiser License | 752 |
| LA | 265 | LA | 701 |
| BATON ROUGE | 47 | BATON ROUGE | 68 |
| NEW ORLEANS | 28 | METAIRIE | 62 |
| METAIRIE | 25 | SHREVEPORT | 43 |
| LAFAYETTE | 17 | LAFAYETTE | 40 |
| SHREVEPORT | 15 | NEW ORLEANS | 37 |
| MONROE | 12 | MANDEVILLE | 33 |
| ALEXANDRIA | 12 | SLIDELL | 21 |
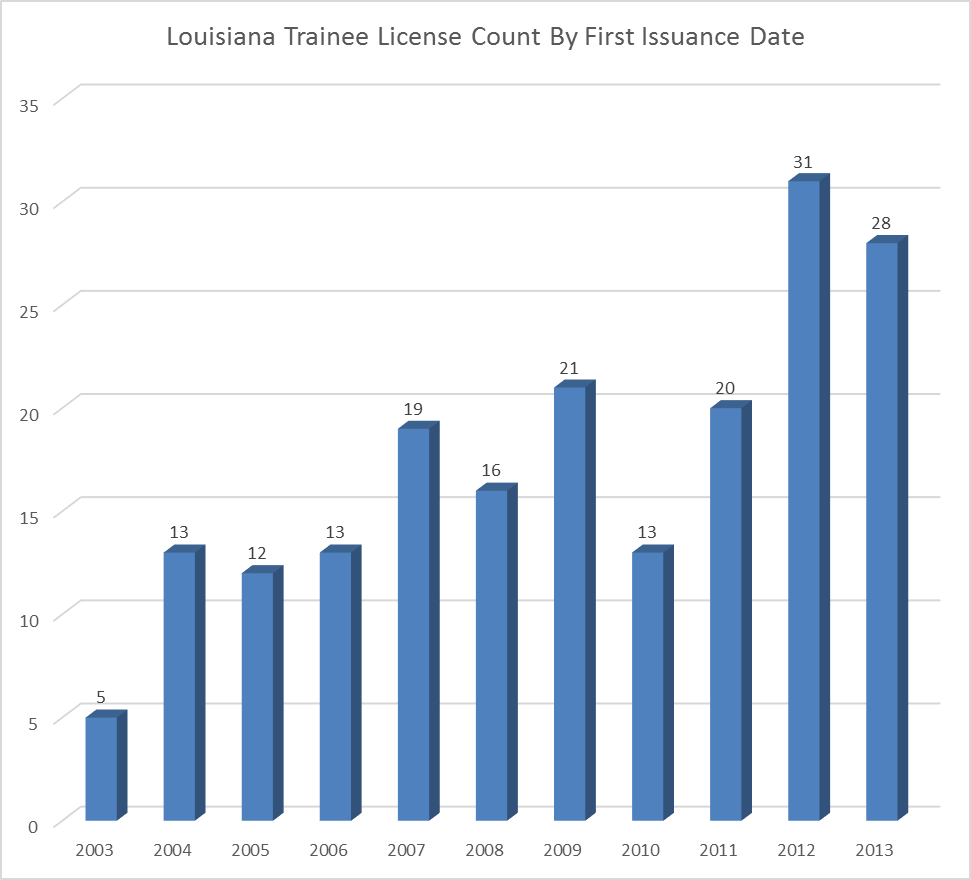
For the 235 Louisiana Licensed Appraiser Trainee Licenses issued, the top 10 cities are:
| NEW ORLEANS | 24 |
| METAIRIE | 18 |
| BATON ROUGE | 14 |
| SHREVEPORT | 11 |
| LAFAYETTE | 9 |
| COVINGTON | 6 |
| DENHAM SPRINGS | 6 |
There are several trainees with more than one supervisor, so the number of actual trainees is 191. There are 17 (8.9%) trainees with no supervisor, which means they cannot complete their training and earn their license. Over half of the trainees have not earned their license in the three year minimum time frame, with 40% licensed as trainees longer than 5 years, 22% longer than 7 years and 15% longer than 8 years.
The inability of Licensed Trainees to graduate to a Residential or General License stems from a low percentage of appraisers in Louisiana who utilize trainees to grow their practice. A recent study by the Appraisal Institute shows that on average, 49% of General Licensed Appraisers who perform commercial appraisals and 29% of Residential Licensed Appraisers utilize a full-time Licensed Appraiser Trainee in their practice. The percent of Louisiana Residential or General Appraisers who use a Licensed Appraiser Trainee is only 15%.

Chart Trainee Utilization
The study by the Appraisal Institute in June 2013, showed that 21% of commercial appraisers and 7% of residential appraisers utilized 4 or more trainees in their practice. Of the residential appraisers who utilized trainees, 93% employed 1 to 3 appraisers. In Louisiana, only two of the 966 appraisers in the state utilized 4 or more trainees, resulting in a comparison percentage of 0.21%.

Chart of Utilization Of 4 Or More Trainees
Sources:
Appraisal Institute, June 28, 2013, study by Appraisal Institute Research Department.
Census Bureau, 2010 survey.
Louisiana Real Estate Commission.
This presentation discusses using the latest technology to help you select a great location for a business. You won’t believe the things businesses know about you, when they are looking to put in a new location in your neighborhood.
 New Orleans is almost 300 years old, so classifying and describing commercial real estate can be tricky. That's because New Orleans has 100 year old buildings that look better on the inside than brand spanking new construction. To help with the confusion, many commercial real estate specialists use the building classes defined by the Building Owners and Managers Association which few people understand. Let's review the classes of buildings and clear up the confusion.
Building Class Definitions
For the purposes of comparison, office space is grouped into three classes in accordance with one of two alternative bases: metropolitan and international. These classes represent a subjective quality rating of buildings which indicates the competitive ability of each building to attract similar types of tenants. A combination of factors including rent, building finishes, system standards and efficiency, building amenities, location/accessibility and market perception are used as relative measures. The metropolitan base is for use within an office space market and the international base is for use primarily by investors among many metropolitan markets.
Building amenities include services that are helpful to either office workers or office tenants and whose presence is a convenience within a building or building complex. Examples include food facilities, copying services, express mail collection, physical fitness centers or child care centers. As a rule, amenities are those services provided within a building. The term also includes such issues as the quality of materials used, hardware and finishes, architectural design and detailing and elevator system performance. Services that are available readily to all buildings in a market, such as access to a subway system or proximity to a park or shopping center are usually reflected in the quality of the office market and therefore all buildings are affected. The class of a specific building may be affected by proximity only to the degree that proximity distinguishes the building (favorably or unfavorably) from other buildings in the market. The purpose of the rating system is to encourage standardization of discussion concerning office markets, including individual buildings and to encourage the reporting of office market conditions that differentiate among the classes.
Class A
Most prestigious buildings competing for premier office users with rents above average for the area. Buildings have high quality standard finishes, state of the art systems, exceptional accessibility and a definite market presence. Covered parking inside the building structure is provided.
Class B
Buildings competing for a wide range of users with rents in the average range for the area. Building finishes are fair to good for the area and systems are adequate, but the building does not compete with Class A at the same price.
Class C
Buildings competing for tenants requiring functional space at rents below the average for the area. Older structures suffering from deferred maintenance.
![]() While the average occupancy of Class A office space in Metairie is 94% and in New Orleans CBD is 88%, why are tenants leaving Metairie to lease space in downtown New Orleans and why are some Class A CBD buildings experiencing occupancy as low as 60%? This analysis answers those questions with graphs of the latest information on the office market in the New Orleans area.
While the average occupancy of Class A office space in Metairie is 94% and in New Orleans CBD is 88%, why are tenants leaving Metairie to lease space in downtown New Orleans and why are some Class A CBD buildings experiencing occupancy as low as 60%? This analysis answers those questions with graphs of the latest information on the office market in the New Orleans area.
There is 13,800,000 square feet of office space in the New Orleans area, composed of the class A market in New Orleans totaling 8,800,000 square feet and Metairie totaling 2,000,000 square feet, and the class B market in New Orleans of 1,600,000 square feet and Metairie totaling 1,400,000 square feet.
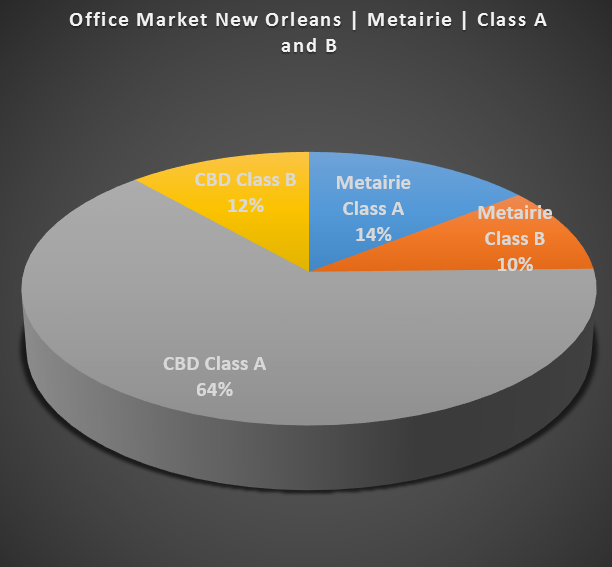
pie office market all
The office market can be categorized into class A and class B for New Orleans and Metairie. Marshall and Swift and the Dictionary of Real Estate Appraisal, used by commercial property appraisers, describes class A as "high quality, well-designed, using above average materials and sought by investors and tenants since it is well maintained and managed, with above average rents, making them the most desirable buildings in the market". Class B buildings are defined as "offering useful space without special attractions, and while not unique, have functionality and good layout, with average rents and average to good management and maintenance, and are typically 10 to 50 years old and do not compete with class A buildings at the same price".
The Metairie class A office market is larger than the class B, with rents averaging $23.56 compared to $18.72.

pie metairie office class A vs. B
The New Orleans office market tells a different story, with class A five times the size of the class B market, with rents averaging $18.59 compared to $16.51. The lower class A rent rate is causing tenants to move from Metairie to downtown New Orleans.
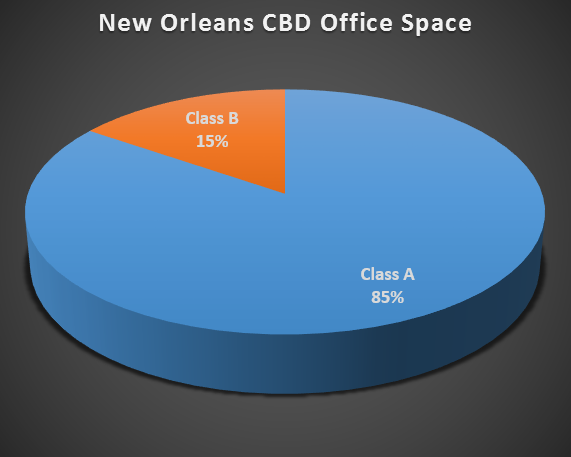
pie CBD market class A vs. B
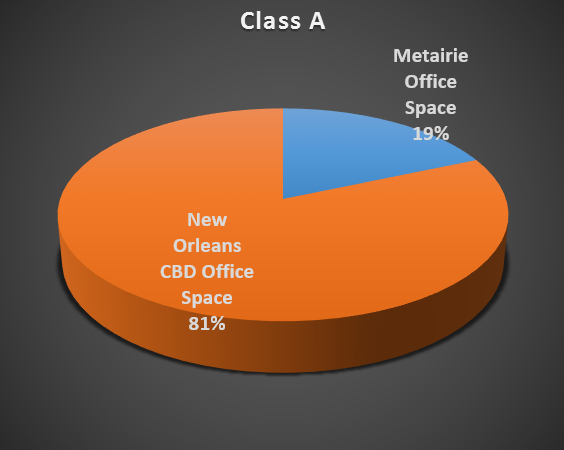
The New Orleans class A office space totals 8,800,000 square feet, with 1,019,000 for lease. Metairie class A totals 2,000,00 square feet with 97,000 square feet for lease. With lots of class A space available, tenants are moving out of class B office space causing market rates to drop since more space is for lease.
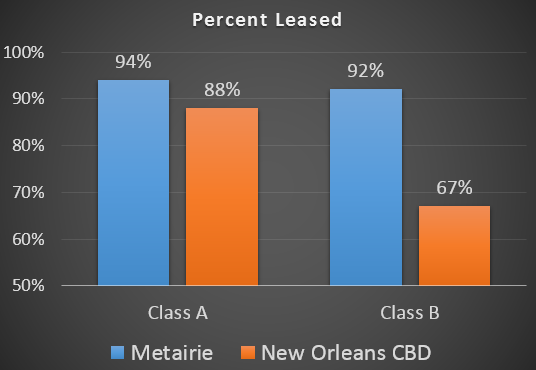
chart percent leased
Of the 1,019,000 square feet of CBD class A office space, 451,000 is composed of full floor space which takes longer to lease because it requires a company with at least 50 employees looking to move. In 2013, only three companies leased large full floor office space in CBD class A buildings, and only one of the three leased new space, with the other two large spaces leased due to a move from a previous CBD class A space or due to a renewal.
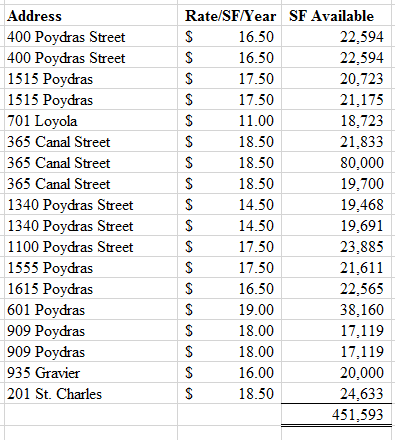
table full floor SF
The New Orleans market is five times larger than the Metairie class A market.
pie class A
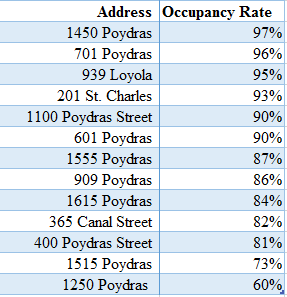
Even though the average occupancy rate for class A New Orleans CBD office space is 88 percent, there is a wide dispersion about the mean. The highest occupancy goes to 1450 Poydras Street, owned by Tom Benson, which is 97 percent leased with tenants like the State of Louisiana as part of his negotiations as owner of the New Orleans' Saints. 701 Poydras enjoys 96 percent occupancy due to 600,000 square feet leased to Shell Oil Company. The lowest occupancy rate of 60 percent falls to 1250 Poydras Street, who suffered a departure of FEMA and a major oil company's move to Houston.
cbd occupancy