The largest contiguous Class A office tower space for lease in New Orleans' CBD is now available, according to Robert Hand, president of Louisiana Commercial Realty, who is co-marketing the office space with Maria McLellan, Associate Broker of Corporate Services with Gulf States Real Estate Services, LLC. The space encompasses four full floors at 1250 Poydras Street, located on the corner of Loyola Avenue and Poydras Street, in downtown New Orleans. The office space is available for sublease until October 31, 2018.
"The space is strategically located in the center of all the new and exciting activity in downtown New Orleans. It is next door to Champion's Square and the Superdome, across the street from City Hall and the new $200 million dollar South Market mixed-use development, adjacent to the $275 million dollar Hyatt Hotel, on the new Loyola Avenue streetcar line and near the 45 story 1001 Howard | Plaza Tower $100 million dollar redevelopment. There's more activity in this area than anywhere else in downtown New Orleans," said Robert Hand, president of Louisiana Commercial Realty.

floor 20 boardroom
Associate Broker Maria McLellan, says, "There's nothing like it in New Orleans. All four floors are fully furnished, the space is in “move-in” condition, located in the same elevator bank with the highest security available, and comes with covered parking via a skywalk to the adjacent Hyatt Hotel. This space has over 200 private offices, 15 conference rooms, 28 storage rooms, kitchens, a data center, telecommunications room and its own backup generator."

floor 20 reception area
McLellan believes the office space will be leased by a new industry relocating to Louisiana, and is targeting the digital media industry. New Orleans is an attractive destination for relocating companies because of its dynamic business environment, tax incentives, and world-renowned culture. That was GE Capital’s logic in opening its GE Capital Technology Center in 2012, according to a February 2012 BusinessWire article. “New Orleans has many of the things we need to build a center – a great location, talent, and an attractive business environment,” Brackett Denniston, GE’s senior vice president and general counsel, said.
Generous New Orleans' business incentives add to the city’s attraction, particularly for media and software companies. Hand says, "A 2010 report by the Brookings Institution showed that New Orleans has pushed far ahead of the rest of the nation in business creation. We lead the nation in providing incentives for businesses. For example, there is a 35% rebate for digital media payroll. There is a 25% tax credit for hardware expenditures. That is a dollar-for-dollar tax credit. There is a 50% bonus depreciation and tax exempt financing at a 2% interest rate. There is a tax credit for live performances up to 25% of expenditures. There is a tax credit of 30% which can also be sold on movie expenditures. There is a 39% federal plus a 25% state New Market Tax Credit for development. There is a 25% tax credit for Sound Recording expenditures. Just to name a few."

1250 Poydras Office Tower
Here is a short list of the business incentives which seem to be driving new industry to Louisiana:
Louisiana's 35% Digital Interactive Media and Software Development refundable tax credit — the strongest of its kind in the nation — is helping traditional and digital companies of all sizes gain a competitive edge.
The refund is available at the end of each year for 100% of its value claimed on Louisiana state tax return or certified applicants can receive 85% of the value earned as a rebate any time during the year. Development must be for digital media sold as a product.
The Enterprise Zone is a jobs incentive program that provides Louisiana income and franchise tax credits to a new or existing business located in Louisiana creating permanent net new full-time jobs, and hiring at least 50% of those net new jobs from one of four targeted groups. The benefit provides a one-time $2,500 job tax credit for each net new job created. A 4% rebate of sales and use taxes paid on qualifying materials, machinery, furniture, and/or equipment purchased or a 1.5% refundable investment tax credit on the total capital investment, excluding tax exempted items.
The Research and Development Tax Credit encourages existing businesses with operating facilities in Louisiana to establish or continue research and development activities within the state. Provides up to a 40% tax credit of global payroll on qualified research expenditures incurred in Louisiana — with no cap and no minimum requirement.
This Program provides a cash rebate as an incentive to encourage targeted businesses to locate in Louisiana, create quality jobs and promote economic development. The cash rebate is an annual rebate for up to 10 years of 5% of gross annual payroll for hourly wage rates of at least $14.50, or 6% of gross annual payroll for minimum hourly wage rates of $19.50. Additionally, businesses that expand or locate are eligible for a state rebate of 4%, and a local rebate for sales/use taxes paid on equipment, machinery and construction materials.
The Competitive Projects Payroll Incentive Program provides, by invitation only, an incentive rebate of up to 15 percent of a participating company's new payroll for up to 10 years. Additionally, a participating company will be eligible for either a rebate of state sales and use taxes on capital expenditures or 1.5 percent project facility expense rebate.
Provides customized workforce recruitment, screening and training to any manufacturing, corporate headquarters, warehouse and distribution, or research and development company, at no cost.
Prices for office space in New Orleans have averaged $16.41 per square foot recently, up from $15.25 in 2006, as shown in the chart below.
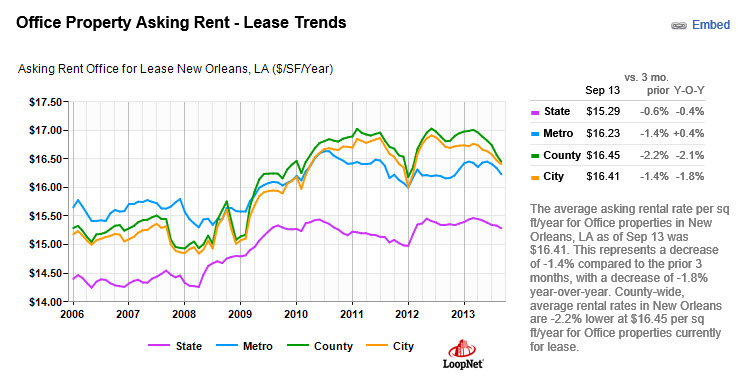
chart market trends
About Louisiana Commercial Realty LLC
Louisiana Commercial Realty LLC is renowned for its creative problem solving in marketing high value, complicated commercial properties. President Robert Hand is the only commercial real estate broker in Louisiana with an MBA and the CCIM and SIOR designations.
About Gulf States Real Estate Services LLC
Gulf States Real Estate Services LLC works with corporate users, land owners, institutional and private investors to identify, acquire, and oversee all aspects of development, leasing, sales, and construction activity. Maria McLellan has twenty years of commercial real estate experience helping national, regional and local companies lease over one million square feet of office space. She offers a comprehensive service including: assessment, market analysis, site inspection, site selection, proposal development, contract negotiation, and managing the entire move-in process.
For investors and/or commercial brokers, negotiating a commercial real estate contract can be rather daunting. If done incorrectly, then the losses can be astronomical. It is critical that you know the key provisions of a commercial real estate contract and how to effectively negotiate terms.
First and foremost, it is important to understand what your main objective of the negotiation will be. For example, is your objective to obtain the lowest price for the property? Or is your objective to close within an acceptable time frame? You get the idea. Since negotiating is a process of communication with the intent to reach a joint agreement, then it is important that you know what you want to communicate. You will notice that the Donald Trump’s of the world bring an attitude of high expectations to the negotiating table, every time.
Next, decide whether you will take a cooperative or combative approach. It should be no surprise that the cooperative approach tends to be the most effective and efficient way to negotiate. The combative approach, which includes negative comments, emotional statements, table pounding, etc…, does not leave room for any creative problem solving solutions. If you are negotiating with a combative negotiator, then it is helpful to the entire process if you do not respond emotionally. Also, do not argue and at the same time do not ignore their arguments. Furthermore, when dealing with a combative negotiator, always back up your statements with written facts.
Many people when entering into a negotiation for commercial real estate do not know that every point of the contract is negotiable. Remember that all the points in an offer can be used to help structure the deal. When followed, all the points in an offer can offer trade-off opportunities for both parties to reach a satisfactory negotiation.
Before you walk into a negotiation it is important to understand your leverage. The more that you know about the buyer’s or seller’s needs, then chances are you will be prepared with solutions for those obstacles.
Contract negotiation can be a sensitive time. Therefore, it is important that you act with integrity and try to develop a trust with the other party. If you can find some common ground with your buyer or seller, then you will be in a stronger negotiating position.
When negotiating price, know that buyers typically offer less than the list price. There is no standard percentage under the list price that is applicable when negotiating a commercial real estate contract. Market analysis’s show all the recent sales for the area, which is the best way to reference when establishing an offer.
If you are lucky enough to receive multiple offers, then it is beneficial for all parties involved to be given the opportunity to raise or adjust their offer within a set time frame. Then after that time frame the seller can review all the offers and decide which one to accept.
Finally, there is no one way to negotiate a commercial real estate contract. Just negotiate.
P![]() OSTPONING TAXES WITH 1031 EXCHANGES
OSTPONING TAXES WITH 1031 EXCHANGES
The 1031 exchange, also termed the Starker exchange or tax-deferred exchange, allows you to sell investment property and to defer capital gains and depreciation recapture taxes. Assuming that you are reinvesting 100% of the equity into “like-kind” property of equal or greater value. “Like-Kind” property is any property held for investment purposes. The idea behind 1031 exchange is that when an owner has reinvested the sale proceeds into another property, the economic gain has not yet been realized in a way that generates funds to pay any taxes. In other words, it would be unfair to tax a person on a paper gain, so to speak.
It is important to note that the 1031 exchange merely defers the tax. If and when the investment property is ultimately sold, the original deferred gain plus any additional gain realized, is subject to tax.
There are five different types of 1031 exchanges. There is the Simultaneous Exchange, which is when the exchange of the relinquished property occurs at the same time. The Delayed Exchange is common and occurs when there is a time gap between the transfer of the relinquished property and the acquisition of the replacement property. Next, the Build-to-Suit Exchange allows for the taxpayer to build on or make improvements to the relinquished property, using the exchange proceeds. The Reverse Exchange is when the replacement property is acquired prior to transferring the relinquished property. Finally, the Personal Property Exchange is when exchanges are not limited to real property; meaning personal property can also be exchanged for other personal property of like-class.
The advantages of 1031 Exchange are that there are relatively few other methods available for postponing taxes on the sale of an investment property. Another advantage of the exchange is that when you defer the tax you then have more money available to invest with. Also, any gain from depreciation recapture is postponed. The other benefit of the 1031 Exchange is that you can acquire and dispose of properties to reallocate your investment portfolio without paying tax on any gain.
The disadvantages of the 1031 Exchange are that you will have a lower depreciation schedule when you go to acquire new properties and that losses on your income tax return cannot be deducted if you exchange property rather than sell it. Therefore, if you do not want to take a loss, call it a sale and not an exchange.
In summary, the requirements for 1031 Exchange are rather simple. First, an actual exchange must take place. Second, the transfer must involve real property for real property. Additionally, the properties that are sold and acquired by you must be held for productive use in a trade, business or as an investment. There is a 45 day and a 180 day maximum timing requirement for identifying and acquiring replacement property. Finally, Section 1031 is mandatory, meaning that if you fulfill the prior requirements, then the IRS will consider your action an exchange even if you did not intend for it to be so.
There will always be risks involved when purchasing a piece of investment property. However, the goal is to minimize these risks as much as possible. The following are several potential sale contract pitfalls you may want to avoid.
It is critical that you find out if there are any defects in title before you sign on the dotted line. Since property is recorded in the form of a deed, research the public record system for the deeds to your potential real estate investment property. Sometimes, deeds are not recorded and sometimes people sell or transfer partial interests in property. It is more common than not those easements are given to cross over or use property that may or may not be of record. Additionally, a judgment against a person can be recorded and become a lien against any real property that the person owns, even without their consent. All of these issues can become a lien against title. It is better to know what you are purchasing beforehand, than to find out ten minutes before signing or even after signing the sale contract.
In the same sense, your potential investment may have a mechanics lien on it. A mechanics lien is a statutory lien that contractors, laborers, etc… may place on a property that they have performed work on. Ultimately, a mechanics lien could be used to foreclose a property.
Commercial loans, oftentimes, will require that a business maintain a certain net equity. Also, there may be pre-payment penalties, which are common on real property loans. Read the fine print and ask the appropriate questions. Lenders for large, commercial real estate deals require that there legal fees and costs be paid by the borrower(s).
For many commercial real estate investors, zoning issues can become a major sale contract pitfall. It is imperative that you make sure that not only is the relevant property zoned, but also that the zoning of nearby and adjacent properties is correct. Issues can arise down the road if government agencies or neighbors try to change the zoning on your property to limit your use of it. So, know your zone.
If you are an investor or commercial broker, then you know that changes in property values and other market fluctuations can have a profound effect on your investments. When rents go up and down and tenancy rates increase and decrease, these market fluctuations will have an impact on your property. That is why it is important to figure out when you go to sell or lease your property what the current market values are and that the property is priced correctly.
Finally, probably one of the biggest potential concerns when owning commercial property are hazardous wastes or environmental clean up problems. It is the property’s owner who is responsible for fixing any hazardous waste or environmental problems, even if the current property owner did not cause them. Also, if you are found to be in the chain of title to a contaminated property, you are then potentially responsible for paying for its clean up.
A triple net lease, also known as a true net lease, is when the tenant or lessee agrees to pay all the taxes, insurance and common area maintenance expenses that arise from the use of the property, in addition to the basic rental space costs. In a triple net lease the tenant is also responsible for all costs associated with repairs or replacement of structural building elements of the property. It is common for the expenses to increase over time, with a triple net lease.
There are both advantages and disadvantages to triple net leases. First, one advantage of a triple net lease is that the rents tend to be lower, than in other leases. The lower rents makes those types of leases favorable for real estate investors, since all the expenses incurred on the investor are decreased due to the financial responsibility of the property from the investor to the lessee.
Triple net leases can be advantageous to the tenant by providing them with many of the advantages of ownership, including control over the property, without substantial capital investment that a new acquisition requires. Also, a triple net lease can last for at least 50 years, which provides a certain type of security for the tenant.
Triple net leases are typically used for freestanding buildings, such as commercial developments or single-tenant sites.
Triple net leases may have some tax disadvantages for the lesser. If the lessee produces losses, then these could be prohibited for their tax advantage due to the passive loss limitations of the Internal Revenue Code Section 469. Also, significant income from these could cause a C corporation to become a Personal Holding Company or an S corporation to lose their status.
This type of lease can be risky to the investor/lesser. Landlords run into the probability that a tenant may not be able to pay the fees and therefore end up allowing the building to go in disrepair. There have been cases where the tenant was unable to pay for the upkeep of the property and so they decided to damage the property in order to collect the insurance money. This is why it is not uncommon for there to be a reserve fund set up for the tenant to make payments to, in case of an emergency or repairs.
A triple net lease is constructed between the tenant and the lesser, on a case by case basis. There may be certain restrictions or stipulations found within the contract. For example, terms of the lease may include a cap on the total amount on property taxes that the tenant is required to pay. Therefore, if the property taxes rise above a certain amount, then the lesser will be responsible to pay the remainder. There may also be certain caps on the rise of insurance rates and/or the cost of maintenance.
If you are considering a triple net lease, then it is imperative that you make sure that you understand and agree upon all the terms.
![]() Even though large tracts of vacant land are scarce in New Orleans, it can be difficult to accurately value raw land. This article explains how sophisticated commercial property investors value land to determine if their development is feasible.
Even though large tracts of vacant land are scarce in New Orleans, it can be difficult to accurately value raw land. This article explains how sophisticated commercial property investors value land to determine if their development is feasible.
How property is valued will surprise you. The value depends on how the site is utilized. It's called highest and best use. A gas station is more profitable than a car wash, so it can pay more for the land in order to get a business into commerce. A hotel is more profitable than a gas station, so it can pay more for the land. When property is put to the highest and best use, the resources are allocated properly, everyone benefits. The public benefits from the highest taxes on the property coming into the city coffers. The seller benefits from receiving the best price. The buyer benefits because the property allows a feasible project to put capital to work and earn a desired rate of return. So the value is not what the seller paid for the land. That is sunk cost and immaterial to a buyer. The value is what the highest price is that makes the new use of the property feasible.
Land Residual Technique
It is called the Land Residual Technique: a method of estimating land value in which the net operating income attributable to the land is capitalized to produce an indication of the land's contribution to the total property.
The land residual technique is but one of the residual techniques available. Another technique, and one more common in the highest and best use analysis, is the cost analysis version. With this technique, a hypothetical building is constructed that represents the highest and best use of the site. Deductions are then made for the creation costs (i.e. labor, capital, and entrepreneurship) to arrive at a residual value for the underlying site. Both techniques have their place and, depending on the available data, can be very useful in estimating site values or in connection with a proper, well-supported highest and best use analysis. Let's try an example. What if you were planning to build a hotel on land that is currently a parking lot? How would you value the land under a 340 room hotel assuming $200 per night rates at 60 percent occupancy with overall expenses at 60%?
?Rent is $200.00/night.
?Vacancy and collection loss is 40%.
?Expenses to the landlord are 60%.
?Overall capitalization rates for a property like the subject property are 10%.
?Constructions costs are $175,000 per room but does not include the site value.
Determine the net operating income (IO) for the property.
Potential Gross Income (340 rooms x $200/night) $25,000,000
Less: Vacancy & Collections (40%) $10,000,000
Effective Gross Income $15,000,000
Expenses (60%) $9,000,000
NOI (IO) $6,000,000
Capitalize the NOI (IO) into a value.
VO = NOI (IO) / Cap Rate
VO= $6,000,000/ 0.10
VO= $60,000,000
Deduct the construction costs from the total costs (except land).
VL= $60,000,000 - $59,500,000 (340 rooms at $175,000 each)
VL= $500,000
The end value is $500,000 but that is not the value of the land. The value of the land is best determined by the market, or what the values are of other like properties that can also be purchased and put to the same use. What the end value does tell us is the maximum price the developer can pay for the land and still make the project feasible.
If the land asking price is higher than $500,000, the developer has to find a way to reduce construction costs or increase net operating income through reduced expenses or increased revenues, or not buy the property.
Sources: www.louisianacommercialrealty.com, Appraisal Institute: Advanced Spreadsheet Modeling
New Orleans East is an area with seven times the national population growth rate and an estimated 100,000 people with median household income of $43,000 who are underserved by businesses yet to come back to the area. An opportunity exists for retail businesses to come to the area and this report examines which businesses are in demand. Our analysis shows a current need for furniture stores, supermarkets, lawn and garden stores, sporting goods and clothing stores. This report examines not only the demographics of population, income and age, but also the consumer spending behavior and compares spending in this area to the national average in a variety of categories to determine where spending is higher than normal, called the Market Potential Index. We also conduct a Retail Gap Analysis, where we determine where the gaps are in money spent on goods and services and businesses selling goods and services, and calculate the Leakage Factor showing money spent outside the area which could be spent inside the area, if only businesses were there to provide the goods and services.
Neighborhoods
This analysis shows there is real demand for supermarkets and estimate $111,000,000 is currently spent on food at home, but we also drill down in the data to determine what types of items a supermarket could sell to have a competitive advantage. For example, within a 10 minute drive time, there is $38,000,000 spent on snacks for food at home. There is little competition for some of these needed industries. Currently there is no sporting goods store or clothing or department store in the area. There are only two Winn-Dixie supermarkets and none along the I-10 corridor where demand is highest.
The area has enjoyed a neighborhood rejuvenation with major developments such as the new Lowe’s on Read Road, a proposed library at Lake Forest, a new Methodist Hospital on Read Road near I-10 which was recently purchased by the City of New Orleans, and the new $40 million dollar Village de Jardin, a 224-unit mixed-use senior housing center near Crowder and I-10. The area is also unique in that it is close to four colleges and universities, an airport, and also major employers like NASA and Lockheed Martin.
Until the late 1800’s, New Orleans East was outside of the city limits of New Orleans, although within Orleans Parish. There was little development other than in two areas. The first area hugged the long, narrow ridge of higher ground along Gentilly Road, which followed the natural levee of an old bayou. Various farms, plantations, and small villages such as Michoud were sited along this ridge. The other older area of development consisted of a linear strip of "camps", clusters of houses raised high on wooden stilts, in the shallows along the edge of Lake Pontchartrain, the largest and longest-lasting of these being at Little Woods.
In the early 1900’s some residential development of the area began, at first as an extension of Gentilly. Construction of the Industrial Canal began in 1918 and was completed in 1923, creating the principal barrier that would separate the East from the rest of New Orleans. New Orleans East's present southern boundary was realized in 1944 with the completion of a re-routing of the Intracoastal Waterway, involving the excavation of a new segment stretching east from the Industrial Canal to the Rigolets and cut through the raw swampland south of the Gentilly Ridge and north of Bayou Bienvenue.
The great growth of the East did not occur until after World War II, and particularly commenced during the administration of Mayor Vic Schiro (1961–1970). Many new subdivisions were developed in the 1960’s and 1970’s, to cater to those who preferred a more suburban lifestyle but were open to remaining within the city limits of New Orleans. New Orleans East grew in a comparatively well-planned and neatly zoned fashion. Some care was taken to avoid placing major thoroughfares along the rights-of-way of unsightly drainage canals, as had frequently occurred in suburban Jefferson Parish. Instead, major roads such as Mayo, Crowder, Bundy, Read, and Bullard were located equidistant from parallel canals and were outfitted with landscaped medians, or neutral grounds. Numerous subdivisions were developed with large lakes at their centers, providing both an assist to neighborhood drainage and a scenic backdrop for the backyards of homes. From the late 1960’s onwards, buried utilities were required, lending to new development in the East a pleasingly uncluttered visual appearance quite distinct from the wire-hung stop light signals, tangled webs of power lines, and forests of leaning utility poles common to suburban New Orleans. By 1980, New Orleans East had received significant commercial office and retail investment, epitomized by the regional mall The Plaza at Lake Forest, the largest in Greater New Orleans at the time of its completion.
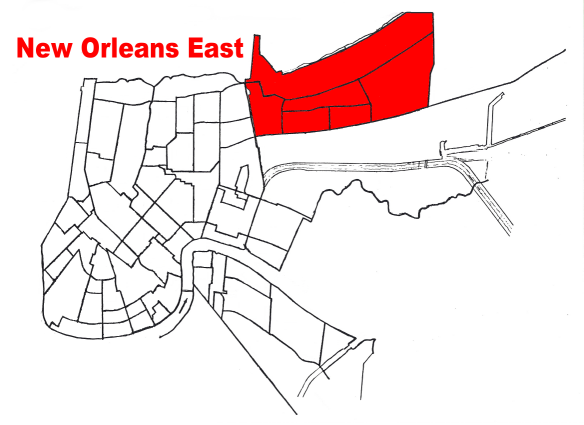
New Orleans East is bounded by the Industrial Canal to the West, the Intracoastal Waterway to the South, Bayou Savage Wildlife Preserve to the East and Lake Ponchartrain to the North.

New Orleans East Boundaries
New Orleans East is primarily zip codes 70126, 70117, 70128 and 70129.
St. Bernard Parish borders the area to the South.

New Orleans East Zip Codes
This analysis focuses on three areas designated by drive times: a 5 minute drive time (blue area), 10 minute drive time (brown area) and 15 minute drive time (green area) from the center of New Orleans East at Read Road and Interstate 10. Notice the 15 minute drive time almost reaches Slidell to the east and extends west to the French Quarter, Central Business District and Lakeside Mall.

Map Drive Times
Within the 5 minute drive time, the population is estimated to grow from 35,217 in 2010 to 45,824 by 2015. This is seven times the national growth rate. The average household income in 2010 was $43,486.
Drive Time: 5 minutes |
||
Demographic Summary |
2010 |
2015 |
Population |
35,217 |
45,824 |
Total Number of Adults |
25,930 |
33,827 |
Households |
11,851 |
15,477 |
Median Household Income |
$43,486 |
$45,717 |
In addition to the population count, we can drill down in the data to determine how the population spends money, which will help determine what businesses are needed. We can examine spending behavior, which is demand, and services offered by current businesses, which is supply, and the result is the Retail Gap Analysis, which will show us what businesses are needed because of unfulfilled demand. These data are based upon national propensities to use various products and services, applied to local demographic composition. Usage data were collected in a nationally representative survey of U.S. households, and forecasts for 2010 and 2015 are prepared by ESRI.
We also calculate the propensity to spend in various categories of consumer behavior within the 5 minute drive time, and the results on the following pages are organized into three columns:
Product/Consumer Behavior |
# Adults |
% Adults |
MPI |
| Apparel (Adults) | |||
| Bought any men's apparel in last 12 months |
12,323 |
47.5% |
94 |
| Bought any women's apparel in last 12 months |
11,154 |
43.0% |
94 |
| Bought apparel for child <13 in last 6 months |
8,367 |
32.3% |
114 |
| Bought any shoes in last 12 months |
13,037 |
50.3% |
96 |
| Bought any costume jewelry in last 12 months |
5,831 |
22.5% |
108 |
| Bought any fine jewelry in last 12 months |
6,888 |
26.6% |
116 |
| Bought a watch in last 12 months |
6,134 |
23.7% |
114 |
| Automobiles (Households) | |||
| HH owns/leases any vehicle |
9,528 |
80.4% |
92 |
| HH bought new vehicle in last 12 months |
815 |
6.9% |
83 |
| Automotive Aftermarket (Adults) | |||
| Bought gasoline in last 6 months |
21,076 |
81.3% |
94 |
| Bought/changed motor oil in last 12 months |
12,762 |
49.2% |
95 |
| Had tune-up in last 12 months |
7,634 |
29.4% |
94 |
| Beverages (Adults) | |||
| Drank bottled water/seltzer in last 6 months |
16,859 |
65.0% |
103 |
| Drank regular cola in last 6 months |
15,119 |
58.3% |
112 |
| Drank beer/ale in last 6 months |
10,697 |
41.3% |
97 |
| Cameras & Film (Adults) | |||
| Bought any camera in last 12 months |
3,988 |
15.4% |
104 |
| Bought film in last 12 months |
5,684 |
21.9% |
93 |
| Bought digital camera in last 12 months |
1,716 |
6.6% |
94 |
| Bought memory card for camera in last 12 months |
1,974 |
7.6% |
100 |
| Cell Phones/PDAs & Service (Adults) | |||
| Bought cell/mobile phone/PDA in last 12 months |
7,482 |
28.9% |
98 |
| Avg monthly cell/mobile phone/PDA bill: $1-$49 |
5,855 |
22.6% |
87 |
| Avg monthly cell/mobile phone/PDA bill: $50-99 |
8,692 |
33.5% |
105 |
| Avg monthly cell/mobile phone/PDA bill: $100+ |
4,280 |
16.5% |
108 |
| Computers (Households) | |||
| HH owns a personal computer |
7,954 |
67.1% |
93 |
| HH spent <$500 on home PC |
1,139 |
9.6% |
106 |
| HH spent $500-$999 on home PC |
2,051 |
17.3% |
94 |
| HH spent $1000-$1499 on home PC |
1,474 |
12.4% |
84 |
| HH spent $1500-$1999 on home PC |
838 |
7.1% |
85 |
| Spent $2000+ on home PC |
719 |
6.1% |
78 |
| Health (Adults) | |||
| Exercise at home 2+ times per week |
6,973 |
26.9% |
91 |
| Exercise at club 2+ times per week |
2,335 |
9.0% |
78 |
| Visited a doctor in last 12 months |
19,688 |
75.9% |
97 |
| Used vitamin/dietary supplement in last 6 months |
11,324 |
43.7% |
92 |
| Home (Households) | |||
| Any home improvement in last 12 months |
3,219 |
27.2% |
87 |
| Used housekeeper/maid/cleaning service in last 12 months |
1,626 |
13.7% |
87 |
| Purchased any HH furnishing in last 12 months |
1,099 |
9.3% |
88 |
| Purchased bedding/bath goods in last 12 months |
6,497 |
54.8% |
100 |
| Purchased cooking/serving product in last 12 months |
2,837 |
23.9% |
88 |
| Bought any kitchen appliance in last 12 months |
1,907 |
16.1% |
91 |
| Insurance (Adults) | |||
| Currently carry any life insurance |
12,504 |
48.2% |
100 |
| Have medical/hospital/accident insurance |
17,639 |
68.0% |
94 |
| Carry homeowner insurance |
12,065 |
46.5% |
88 |
| Carry renter insurance |
1,841 |
7.1% |
118 |
| Have auto/other vehicle insurance |
19,925 |
76.8% |
91 |
| Pets (Households) | |||
| HH owns any pet |
4,523 |
38.2% |
80 |
| HH owns any cat |
2,125 |
17.9% |
77 |
| HH owns any dog |
3,215 |
27.1% |
78 |
| Reading Materials (Adults) | |||
| Bought book in last 12 months |
12,234 |
47.2% |
95 |
| Read any daily newspaper |
10,699 |
41.3% |
96 |
| Heavy magazine reader |
6,411 |
24.7% |
124 |
| Restaurants (Adults) | |||
| Went to family restaurant/steak house in last 6 mo |
18,588 |
71.7% |
98 |
| Went to family restaurant/steak house last mo: <2 times |
6,546 |
25.2% |
97 |
| Went to family restaurant/steak house last mo: 2-4 times |
6,668 |
25.7% |
94 |
| Went to family restaurant/steak house last mo: 5+ times |
5,379 |
20.7% |
106 |
| Went to fast food/drive-in restaurant in last 6 mo |
23,133 |
89.2% |
99 |
| Went to fast food/drive-in restaurant <5 times/mo |
7,347 |
28.3% |
93 |
| Went to fast food/drive-in 5-12 times/mo |
7,657 |
29.5% |
94 |
| Went to fast food/drive-in restaurant 13+ times/mo |
8,131 |
31.4% |
113 |
| Fast food/drive-in last 6 mo: eat in |
8,270 |
31.9% |
83 |
| Fast food/drive-in last 6 mo: home delivery |
3,092 |
11.9% |
107 |
| Fast food/drive-in last 6 mo: take-out/drive-thru |
13,532 |
52.2% |
100 |
| Fast food/drive-in last 6 mo: take-out/walk-in |
6,975 |
26.9% |
110 |
| Telephones & Service (Households) | |||
| HH owns in-home cordless telephone |
6,937 |
58.5% |
91 |
| HH average monthly long distance phone bill: $60+ |
572 |
4.8% |
110 |
| Product/Consumer Behavior |
# Adults |
% Adults |
MPI |
| Convenience Stores (Adults) | |||
| Shopped at convenience store in last 6 months |
15,257 |
58.8% |
98 |
| Bought cigarettes at convenience store in last 30 days |
4,018 |
15.5% |
105 |
| Bought gas at convenience store in last 30 days |
8,343 |
32.2% |
97 |
| Spent at convenience store in last 30 days: <$20 |
2,175 |
8.4% |
86 |
| Spent at convenience store in last 30 days: $20-39 |
2,722 |
10.5% |
105 |
| Spent at convenience store in last 30 days: $40+ |
8,943 |
34.5% |
98 |
| Entertainment (Adults) | |||
| Attended movies in last 6 months |
15,456 |
59.6% |
102 |
| Went to live theater in last 12 months |
2,950 |
11.4% |
90 |
| Went to a bar/night club in last 12 months |
4,139 |
16.0% |
87 |
| Dined out in last 12 months |
10,169 |
39.2% |
80 |
| Gambled at a casino in last 12 months |
3,995 |
15.4% |
96 |
| Visited a theme park in last 12 months |
5,725 |
22.1% |
99 |
| DVDs rented in last 30 days: 1 |
635 |
2.4% |
92 |
| DVDs rented in last 30 days: 2 |
1,089 |
4.2% |
90 |
| DVDs rented in last 30 days: 3 |
843 |
3.3% |
105 |
| DVDs rented in last 30 days: 4 |
1,037 |
4.0% |
100 |
| DVDs rented in last 30 days: 5+ |
3,013 |
11.6% |
88 |
| DVDs purchased in last 30 days: 1 |
1,255 |
4.8% |
90 |
| DVDs purchased in last 30 days: 2 |
1,321 |
5.1% |
97 |
| DVDs purchased in last 30 days: 3-4 |
1,564 |
6.0% |
123 |
| DVDs purchased in last 30 days: 5+ |
1,834 |
7.1% |
131 |
| Spent on toys/games in last 12 months: <$50 |
1,626 |
6.3% |
100 |
| Spent on toys/games in last 12 months: $50-$99 |
657 |
2.5% |
92 |
| Spent on toys/games in last 12 months: $100-$199 |
1,736 |
6.7% |
94 |
| Spent on toys/games in last 12 months: $200-$499 |
2,502 |
9.6% |
93 |
| Spent on toys/games in last 12 months: $500+ |
1,283 |
4.9% |
90 |
| Financial (Adults) | |||
| Have home mortgage (1st) |
3,483 |
13.4% |
74 |
| Used ATM/cash machine in last 12 months |
12,300 |
47.4% |
93 |
| Own any stock |
1,852 |
7.1% |
79 |
| Own U.S. savings bond |
1,439 |
5.5% |
78 |
| Own shares in mutual fund (stock) |
2,067 |
8.0% |
85 |
| Own shares in mutual fund (bonds) |
1,268 |
4.9% |
85 |
| Used full service brokerage firm in last 12 months |
1,367 |
5.3% |
87 |
| Used discount brokerage firm in last 12 months |
575 |
2.2% |
113 |
| Have 401K retirement savings |
3,695 |
14.3% |
86 |
| Own any credit/debit card (in own name) |
17,371 |
67.0% |
91 |
| Grocery (Adults) | |||
| Used beef (fresh/frozen) in last 6 months |
17,573 |
67.8% |
98 |
| Used bread in last 6 months |
25,134 |
96.9% |
101 |
| Used chicken/turkey (fresh or frozen) in last 6 months |
19,679 |
75.9% |
102 |
| Used fish/seafood (fresh or frozen) in last 6 months |
13,945 |
53.8% |
105 |
| Used fresh fruit/vegetables in last 6 months |
22,089 |
85.2% |
99 |
| Used fresh milk in last 6 months |
23,356 |
90.1% |
99 |
| Product/Consumer Behavior |
# Adults |
% Adults |
MPI |
|
|
|
|
|
| Television & Sound Equipment (Households) | |||
| HH owns 1 TV |
2,074 |
17.5% |
88 |
| HH owns 2 TVs |
2,781 |
23.5% |
88 |
| HH owns 3 TVs |
2,761 |
23.3% |
104 |
| HH owns 4+ TVs |
2,827 |
23.9% |
114 |
| HH subscribes to cable TV |
6,969 |
58.8% |
102 |
| HH watched 15+ hours of cable TV last week |
7,308 |
61.7% |
103 |
| Purchased audio equipment in last 12 months |
1,080 |
9.1% |
110 |
| Purchased CD player in last 12 months |
724 |
6.1% |
116 |
| Purchased DVD player in last 12 months |
1,297 |
10.9% |
104 |
| Purchased MP3 player in last 12 months |
910 |
7.7% |
88 |
| Purchased video game system in last 12 months |
998 |
8.4% |
97 |
| Travel (Adults) | |||
| Domestic travel in last 12 months |
11,732 |
45.2% |
86 |
| Took 3+ domestic trips in last 12 months |
4,302 |
16.6% |
80 |
| Spent on domestic vacations last 12 mo: <$1000 |
2,983 |
11.5% |
91 |
| Spent on domestic vacations last 12 mo: $1000-1499 |
1,415 |
5.5% |
79 |
| Spent on domestic vacations last 12 mo: $1500-1999 |
959 |
3.7% |
92 |
| Spent on domestic vacations last 12 mo: $2000-2999 |
868 |
3.3% |
81 |
| Spent on domestic vacations: $3000+ |
1,029 |
4.0% |
82 |
| Foreign travel in last 3 years |
5,340 |
20.6% |
82 |
| Took 3+ foreign trips by plane in last 3 years |
876 |
3.4% |
75 |
| Spent on foreign vacations last 12 mo: <$1000 |
1,201 |
4.6% |
84 |
| Spent on foreign vacations last 12 mo: $1000-2999 |
956 |
3.7% |
93 |
| Spent on foreign vacations: $3000+ |
838 |
3.2% |
69 |
| Stayed 1+ nights at hotel/motel in last 12 months |
9,057 |
34.9% |
84 |
Two conclusions can be drawn from consumer spending data. First, the preceding pages show where the MPI exceeds 100, meaning a higher than average propensity to spend on seafood, chicken or turkey in both the 5 and 10 minute drive time. Second, the population is high enough to support at least four supermarkets, using the assumption that a 50,000 square foot supermarket needs a population of approximately 8,000 residents.
Population |
35,217 |
|
|
Supermarket-Consumer Behavior |
# Adults |
% Adults |
MPI |
Used beef (fresh/frozen) in last 6 months |
17,573 |
67.8% |
98 |
Used bread in last 6 months |
25,134 |
96.9% |
101 |
Used chicken/turkey (fresh or frozen) in last 6 months |
19,679 |
75.9% |
102 |
Used fish/seafood (fresh or frozen) in last 6 months |
13,945 |
53.8% |
105 |
Used fresh fruit/vegetables in last 6 months |
22,089 |
85.2% |
99 |
Used fresh milk in last 6 months |
23,356 |
90.1% |
99 |
10 Minute Drive Time |
|||
Population |
114,408 |
||
Supermarket-Consumer Behavior |
# Adults |
% Adults |
MPI |
Used beef (fresh/frozen) in last 6 months |
55,638 |
66.4% |
96 |
Used bread in last 6 months |
81,008 |
96.7% |
100 |
Used chicken/turkey (fresh or frozen) in last 6 months |
62,963 |
75.2% |
101 |
Used fish/seafood (fresh or frozen) in last 6 months |
44,710 |
53.4% |
105 |
Used fresh fruit/vegetables in last 6 months |
70,776 |
84.5% |
98 |
Used fresh milk in last 6 months |
75,389 |
90.0% |
99 |
We can drill down further in the data to determine how much is spent on food at
home. Within a 5 minute drive time, total amount of money spent on food at home
exceeds $39,000,000, and within a 10 minute drive time exceeds $111,000,000.
The supply of operational large supermarkets is limited to two Winn Dixie
stores, both located to the south on Chef Menteur.

table supermarket demand
Using the industries categorized by NAICS code, research allows us to examine where demand might exceed supply which would dictate that a need for a business in that industry would exist. We can determine supply by estimating sales to consumers by establishments, but sales to businesses are excluded. We forecast demand, or retail potential, by estimating the expected amount spent by consumers at retail establishments. Supply and demand estimates are in current dollars. The gap between demand and supply is called the Leakage Factor, which presents a snapshot of retail opportunity. This is a measure of the relationship between supply and demand that ranges from +100 (total leakage) to -100 (total surplus). A positive value represents ‘leakage’ of retail opportunity outside the trade area. A negative value represents a surplus of retail sales, a market where customers are drawn in from outside the trade area. The Retail Gap represents the difference between Retail Potential and Retail Sales. Retail establishments are classified into 27 industry groups in the Retail Trade sector, as well as four industry groups within the Food Services & Drinking Establishments subsector. Developed in cooperation with Canada and Mexico, NAICS represents one of the most profound changes for statistical programs focusing on emerging economic activities. The system was developed using a production-oriented conceptual framework, grouping establishments into industries based on the activity in which they are primarily engaged. NAICS moves down in detail from Sector to Subsector to Group then to Industry. This is an improvement over the previous method, the 1987 Standard Industrial Classification (SIC) system.
The chart below shows the Leakage Factor by NAICS Subsector for the target area. The highest Leakage Factor shows new businesses needed are:

Leakage By NAICS
Research can get more specific for more detailed level of industry classification which shows unsatisfied demand for industry groups: vending machines, used merchandise retailers, and lawn and garden stores.

Leakage By Industry
The Leakage Factor shows what businesses are needed by the percent that demand exceeds supply, but research also shows the dollar amount of the unfulfilled demand. This can be used to forecast sales for a business coming into the area. New businesses with the highest sales (Retail Gap) are:

table retail gap
The Michoud Assembly Facility is an 832-acre site owned by NASA and located in New Orleans East. Organizationally, it is part of NASA's Marshall Space Flight Center. It is one of the largest manufacturing plants in the world with 43 environmentally controlled acres under one roof, and it employs approximately 3,700 people. Since September 5, 1973, it has been used for the construction of the Space Shuttle's External Tanks by its lead contractor Lockheed Martin. The Michoud Assembly Facility is currently a multi-tenant complex which is currently maintained and operated by Jacobs Technology. in order to allow both commercial and government contractors, as well as government agencies to use the site. The facility was originally constructed in 1940 at the village of Michoud, Louisiana by Higgins-Tucker division of Higgins Industries under the direction of Andrew Jackson Higgins on behalf of the United States government for the war production during World War II to make plywood C-46 cargo planes and landing craft. During the Korean War it made engines for Sherman and Patton tanks. It came under the management of NASA in 1961 and was used for the construction of the S-IC first stage of the Saturn V rocket and the S-IB first stage of the Saturn IB rocket. It is home to the first stage of the last constructed Saturn V, SA-515.
The Michoud Assembly Facility has been most closely associated with the construction and production of NASA's External Tank (ET) program. Throughout the Space Shuttle program, the facility produced 136 tanks. Rollout for ET-1 used for STS-1 was rolled out June 29, 1979. The last flight ready tank, ET-122, rolled out on. Only tank produced at the facility, ET-94, was not used in spaceflight and remained at Michoud as a test article.
The Michoud Assembly Facility also houses other organizations such as the National Finance Center operated by the United States Department of Agriculture, the United States Coast Guard, and the National Center for Advanced Manufacturing, a partnership between the state of Louisiana, the University of New Orleans, Blade Dynamics and NASA.
Within a 5 minute drive time, the growth of population in the area is 7 times the national average, and the satellite map below shows a few of the new businesses in the area such as Lowe’s, McDonald’s, Waffle House, Popeye’s, Day’s Inn, Best Western, Chase, and large developments such as the proposed Methodist Hospital and new $40 million senior housing center Village de Jardin.

rejuvination
Village de Jardin, a 224-unit mixed-use senior housing center in eastern New Orleans between Lake Forest Boulevard and Interstate 10. The $39.7 million project, funded by the Federal Emergency Management Agency and the Louisiana Recovery Authority, is expected to be completed in 18 months. The senior housing section of the complex will consist of two apartment buildings, each five stories tall with 150 either one- or two-bedroom apartments. Space is being considered for a commercial kitchen and dining area, a covered garage, an exercise facility, a lounge, a wellness center/clinic, activity rooms, a common area and administrative and maintenance offices. The attached unit housing is composed of eight buildings with three individual living spaces connected by exterior porches and common garden areas. There will be 14 single-family garden homes. In addition, there will be 45 townhouse-style apartments and retail space for lease. The total amount of FEMA funding available for the project is $46.4 million, including $6.6 million previously obligated for demolition of the former Gaslight Apartments.
The Methodist Hospital was purchased on June 16, 2010, by the city of New Orleans for $16.25 million, with Mayor Mitch Landrieu promising to redevelop the vacant building into an 80-bed public hospital that would be the first to open east of the Industrial Canal since Hurricane Katrina in 2005. Administration officials say the city is negotiating with a potential operator for a new hospital and plans to open an emergency department within a year and complete a full renovation sometime in 2013 to serve a population base now at 77,000 and projected to be 105,000 by 2014. The total redevelopment, according to the Landrieu administration’s 100-page review of the health care system in eastern New Orleans, is projected to cost $110 million.
New Orleans East is close to four Universities and Lakefront Airport

universities
In the 5 minute drive time, population from 2000 to 2009 declined from 67,717 to 32,391. The population is expected to grow to 45,693 by 2014. The household growth rate from 2009 to 2014 is among the highest in the US at 7.28%.
5 minute drive time |
10 minute drive time |
15 minute drive time |
|
| Population Density, 2000 |
67,717 |
343,898 |
658,759 |
| Population Density, 2009 |
32,391 |
200,007 |
478,534 |
| Per Capita Income, 2009 |
14,405 |
16,875 |
20,391 |
| Average Household Income, 2009 |
40,743 |
42,560 |
50,039 |
| Renter Occupied Housing Units, 1990 |
45% |
47% |
45% |
| Renter Occupied Housing Units, 2000 |
46% |
47% |
45% |
| Renter Occupied Housing Units, 2009 |
22% |
29% |
33% |
| Renter Occupied Housing Units, 2014 |
32% |
39% |
39% |
| 2009 Population, age 20-24 |
2,426 |
15,489 |
38,109 |
| 2009 Population, age 25-34 |
4,291 |
27,241 |
67,181 |
Households By Income, 2009 |
5 minute drive time |
10 minute drive time |
15 minute drive time |
| under $10,000 |
14% |
16% |
13% |
| $10,000-$19,999 |
17% |
18% |
16% |
| $20,000-$29,999 |
14% |
15% |
13% |
| $30,000-$39,999 |
14% |
12% |
12% |
| $40,000-$49,999 |
9% |
9% |
9% |
| $50,000-$59,999 |
9% |
8% |
8% |
| over $60,000 |
19% |
19% |
19% |
| Households By Income, 2009 |
11,440 |
77,589 |
191,851 |
| 2009 to 2014 Household Growth Rate |
7.28% |
5.92% |
3.34% |
The annual growth rate in the area of 5 minute drive time is 7 times the state and national average (see chart below, Trends 2009-2014).

population growth rate
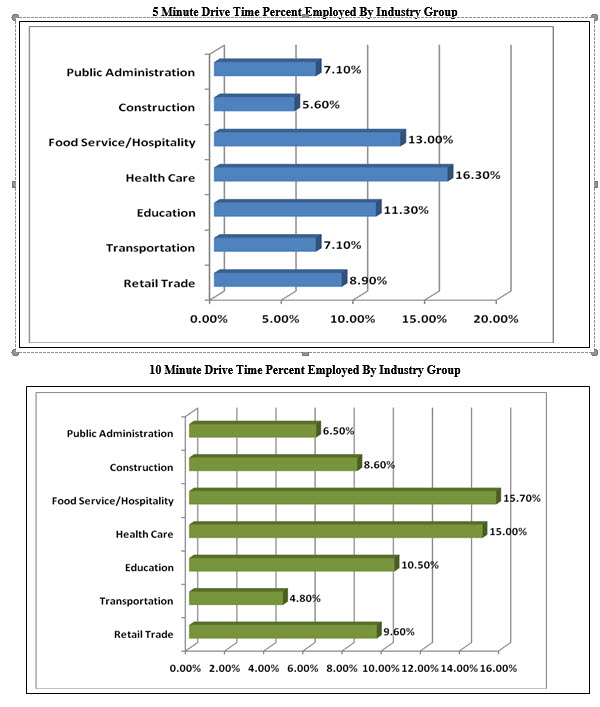
chart industry employment
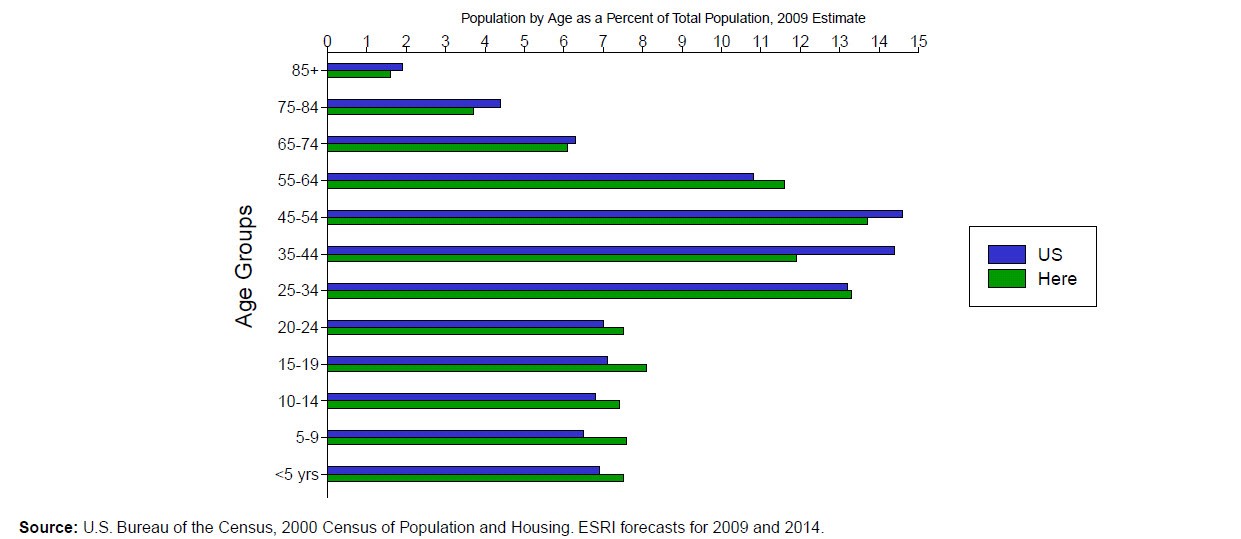
Population within a 5 minute drive time exceeds the US average in every age group below 35, and the 55-64 age group, and 37% of the population with a 5 minute drive time earns over $40,000 annually.
population by age

chart households by income
The 2008 traffic study by the Louisiana Department of Transportation showed the I-10 traffic in New Orleans east between 34,000 and 58,000 cars per day.

traffic count map
Sources: wwwlouisianacomercialrealty.com; US Bureau of Census; ESRI; CCIM Site To Do Business
For a copy of the report in pdf format with original tables and charts, email the author at roberthand@cox.net.
New Orleans Commercial Real Estate is a diversified market with seven different sectors, each sector is different in size. The table below shows the major sectors of the New Orleans commercial real estate market, as well as the average asking prices and actual transaction price variance, and the number of days the property was on the market.

market statistics for new orleans commercial real estate
Currently there is 4.1 million square feet of New Orleans commercial real estate for sale and 3.9 million square feet of New Orleans commercial real estate for lease. Of the space for lease, the office sector comprises 2.4 million square feet, with 1.8 million square feet for lease and 600,000 square feet for sale. The average asking lease rate is $16.35 per square foot but the actual lease rate is around $14 per square foot and has been on the market 590 days. Since 2006, the office lease rates have increased steadily in New Orleans from $15 per square foot, with a few hiccups in 2008 and 2011. The New Orleans office lease rate has been 7% higher than the average lease rate in the state.

chart asking office rents
Source: www.louisianacommercialrealty.com, lacdb, loopnet
![]() Research shows the available space in the Metairie office/warehouse market is the smallest of the six major areas of industrial space in the New Orleans MSA, with just 47,540 square feet, or 1% of the total square footage of available space, as seen in the table and pie chart below.
Research shows the available space in the Metairie office/warehouse market is the smallest of the six major areas of industrial space in the New Orleans MSA, with just 47,540 square feet, or 1% of the total square footage of available space, as seen in the table and pie chart below.
| Market | Warehouse Availability |
| (SF) | |
| CBD | 957,167 |
| East New Orleans | 716,028 |
| Elmwood & South Metairie | 1,188,729 |
| Kenner | 215,664 |
| North Metairie | 47,540 |
| St. Charles & St. John | 448,911 |
| Westbank | 1,110,211 |
| TOTAL | 4,684,250 |

chart of metairie industrial market size
2012 was the second consecutive year of positive absorption of warehouse space which Metairie has not witnessed in six years.

chart showing positive absorption in metairie industrial market
Economics would dictate that such small supply of available space would command high prices, but that would assume demand is constant among all markets, which it is not. Metairie competes with the Elmwood market since it is in close proximity, and the result is a ceiling on prices of available space in the Metairie market. In Elmwood, smaller office/warehouse space rents for an average of $6.00 per square foot and larger spaces average closer to $3.00 per square foot. New Orleans commercial real estate leases typically are triple net, with the tenant paying taxes and insurance.

chart of rental rates 2012 by market
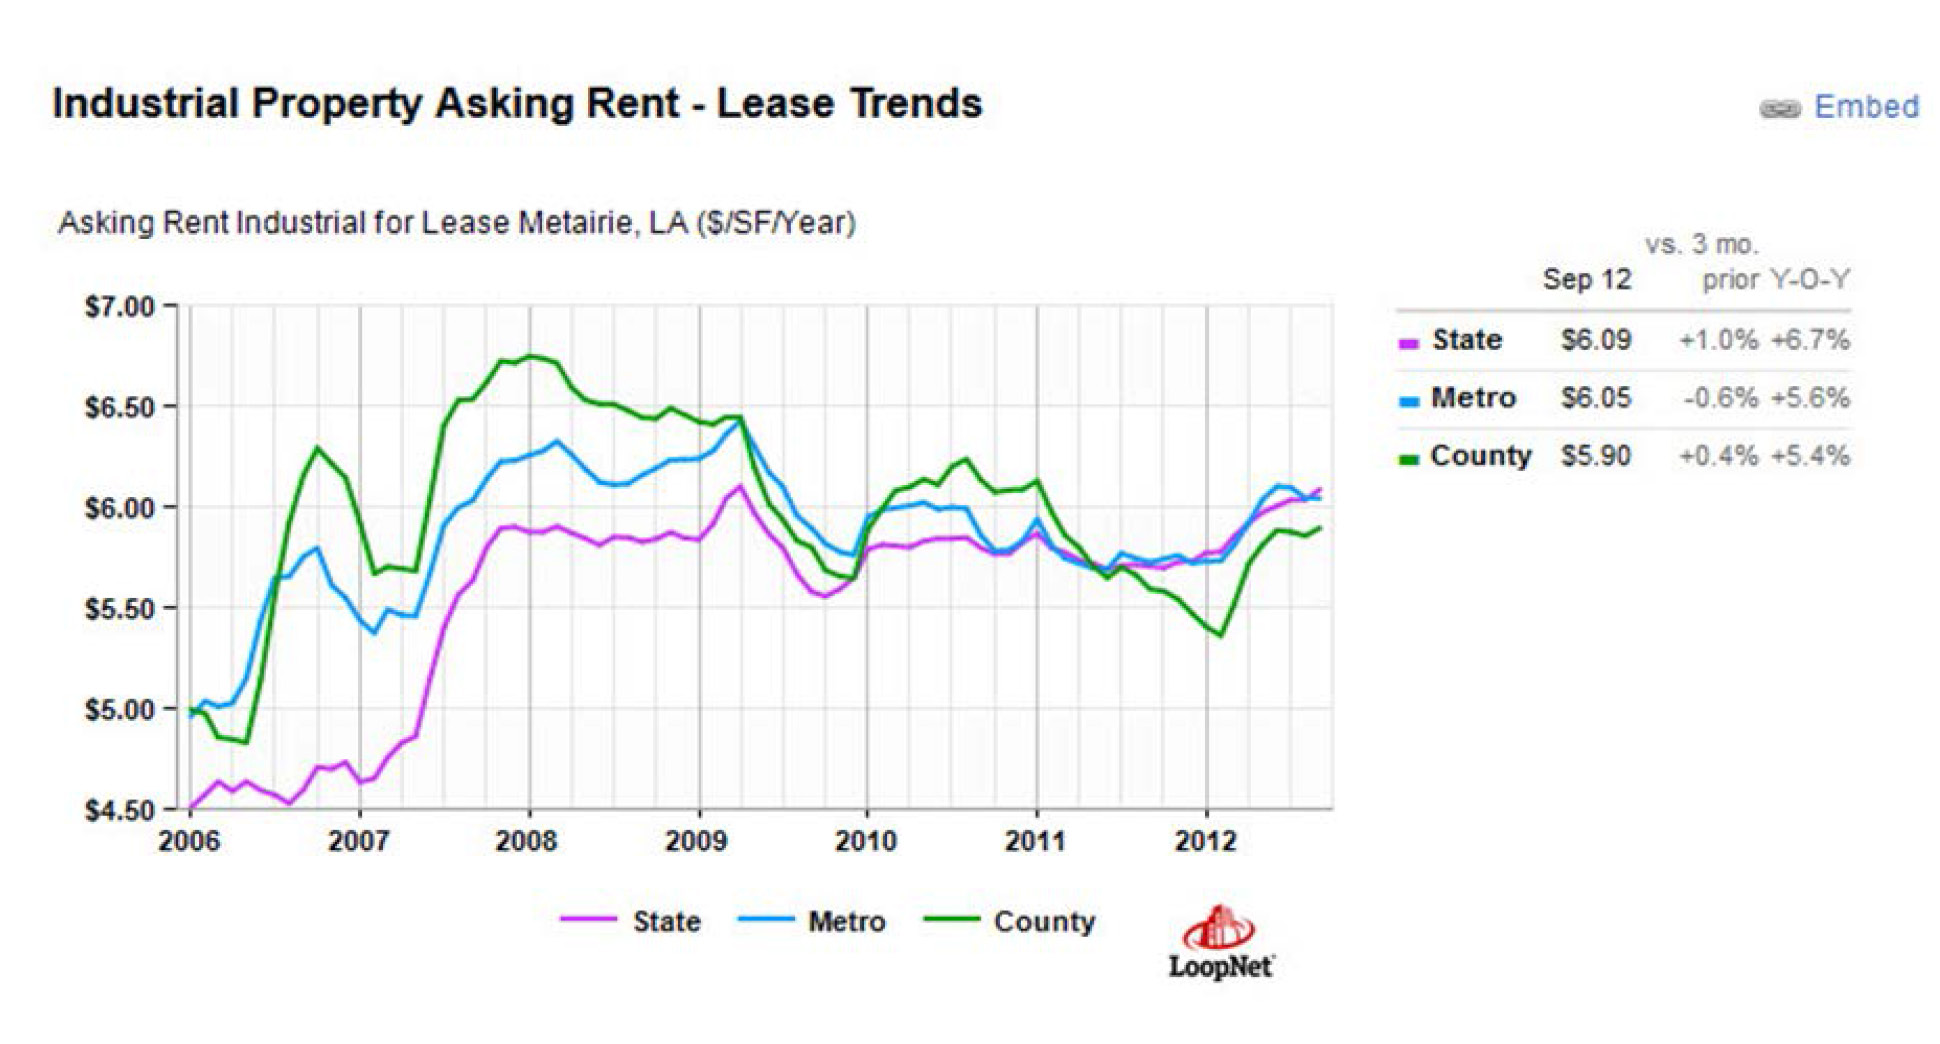
The Loopnet database currently includes only ten listings in the Metairie area, and as of September 2012, the average lease rate was $6.05 per square foot, an increase of 5.6% year over year, down from the peak in 2008 when many post Katrina three year leases were not renewed.
industrial property asking rents
There are currently only ten industrial properties for sale in the Metairie market, according to the Loopnet database, with an average asking price of $51.04, down 8.8% year over year.
A smaller database, LACDB has 21 industrial properties for sale and for lease in Metairie, totaling 236,085 square feet and averaging a sale price of $56.17 or lease price of $5.67 per square foot and have been on the market an average of 211 days. Final transaction prices are reported to have occurred on average at 11.3% below the list price.

industrial property sale prices
sources: Louisiana commercial real estate databases, www.louisianacommercialrealty.com
copyright, 2013, Louisiana Commercial Realty LLC
In the wake of Hurricane Katrina, many New Orleans companies discovered too late that a Business Continuity Plan ensures operations can continue in the event of a disaster. New Orleans commercial real estate firms were especially affected since their continued operation was vital to businesses getting back on their feet by securing new office and distribution space. Large companies have a detailed plan to protect the data on their computer servers but thousands of small firms can use the same template for more common catastrophes like losing a cell phone containing all your contacts, appointments and emails.
Here are the basics of any good Business Continuity Plan:
Sources:
http://www-935.ibm.com/services/us/en/it-services/business-continuity-and-resiliency-services.html
www.purdue.edu
http://web.mit.edu/security/www/pubplan.htm
http://www.finra.org/industry/issues/businesscontinuity/p006464
If you operate a bar or music venue, you already realize the fire marshal can close down your business for a variety of reasons. For example, the allowed capacity is one person for every 7 square feet of space if the property is sprinklered, or 142 people per 1,000 square feet. Property not sprinklered requires 15 square feet per person, or a capacity of 66 people per 1,000 square feet. Even the juke box at F and M's on Tchoupitoulas draws a crowd bigger than that.
Regulations come from a National Fire Code, The Americans for Disabilities Act, The Uniform Construction Code Council and The American National Standards Institute. There is also Energy Code Compliance. In charge of implementing the law is Butch Browning, the Louisiana Fire Marshal, who created the Louisiana State Fire Marshal's Online Manual which draws from Louisana law under Titles 14, 22, 23, and 40 of the Louisiana Revised Statutes.
The Fire Marshall publishes an Annual Report and monthly Interpretive Memos covering topics such as fire alarms, sprinkler systems, emergency evacuation and the kitchen environment. You can get a Plan Review by an architect at the Fire Marshal's Office, and they have satellite offices all over the state. Just call 225-925-4920.
Sources:
http://sfm.dps.louisiana.gov/index.htm
www.louisianacommercialrealty.com
Copyright 2012. #firecode
You would think if a property in Orleans Parish has the same zoning designation as a property in Jefferson Parish, that the permitted use would be the same. Logical, but not true. In Orleans Parish, the C-1, Commercial, zoning designation allows residential, single-family development, but in Jefferson Parish, new single family development is not allowed. You have to read the Jefferson Parish Zoning Code carefully, since the language initially states residential is allowed, but that means existing residential. If you are developing residential on vacant land in Jefferson Parish, you cannot do so in C-1 zoning. Here is how the zoning code actually reads in each parish. Notice how in Orleans Parish you have to follow the lineage since one zoning designation allows a different zoning designation.
In C-1 districts only the following uses of property shall be permitted:
(1) Any existing stand-alone single-family, two-family, three-family, or four-family dwelling shall be recognized as a conforming use; however, the existing stand alone single-, two-, three-, or four-family dwelling cannot be restored if it is destroyed beyond seventy-five (75) percent or more of its value.
The following uses of land are authorized as permitted uses with the C-1 General Commercial District subject to the performance standards of Section 7.5:
The following uses of land are authorized as permitted uses in the B-1 Neighborhood Business District subject to the performance standards of Section 7.5, except that timeshare buildings, transient vacation rentals, bowling alleys, and uses which sell alcohol for consumption on the premises or for consumption off the premises occupying 5,000 square feet or less are prohibited.
The following uses of land are permitted uses within the B-2 Neighborhood Business District subject to the performance standards of Section 7.5, except that timeshare buildings, transient vacation rentals, and bowling alleys are prohibited:
The following uses of land are authorized as permitted uses in the RM-1 Multiple-Family Residential District except that timeshare buildings and transient vacation rentals are prohibited:
The following uses of land are authorized as permitted uses in the RM-2 Multiple-Family Residential District except that timeshare buildings and transient vacation rentals are prohibited:
The following uses of land are authorized as permitted uses within the RS-1 Single-Family Residential District, except that timeshare buildings and transient vacation rentals are prohibited:
The chart below summarizes the Orleans Parish Zoning Code relationships for the C-1, Commercial, designation.
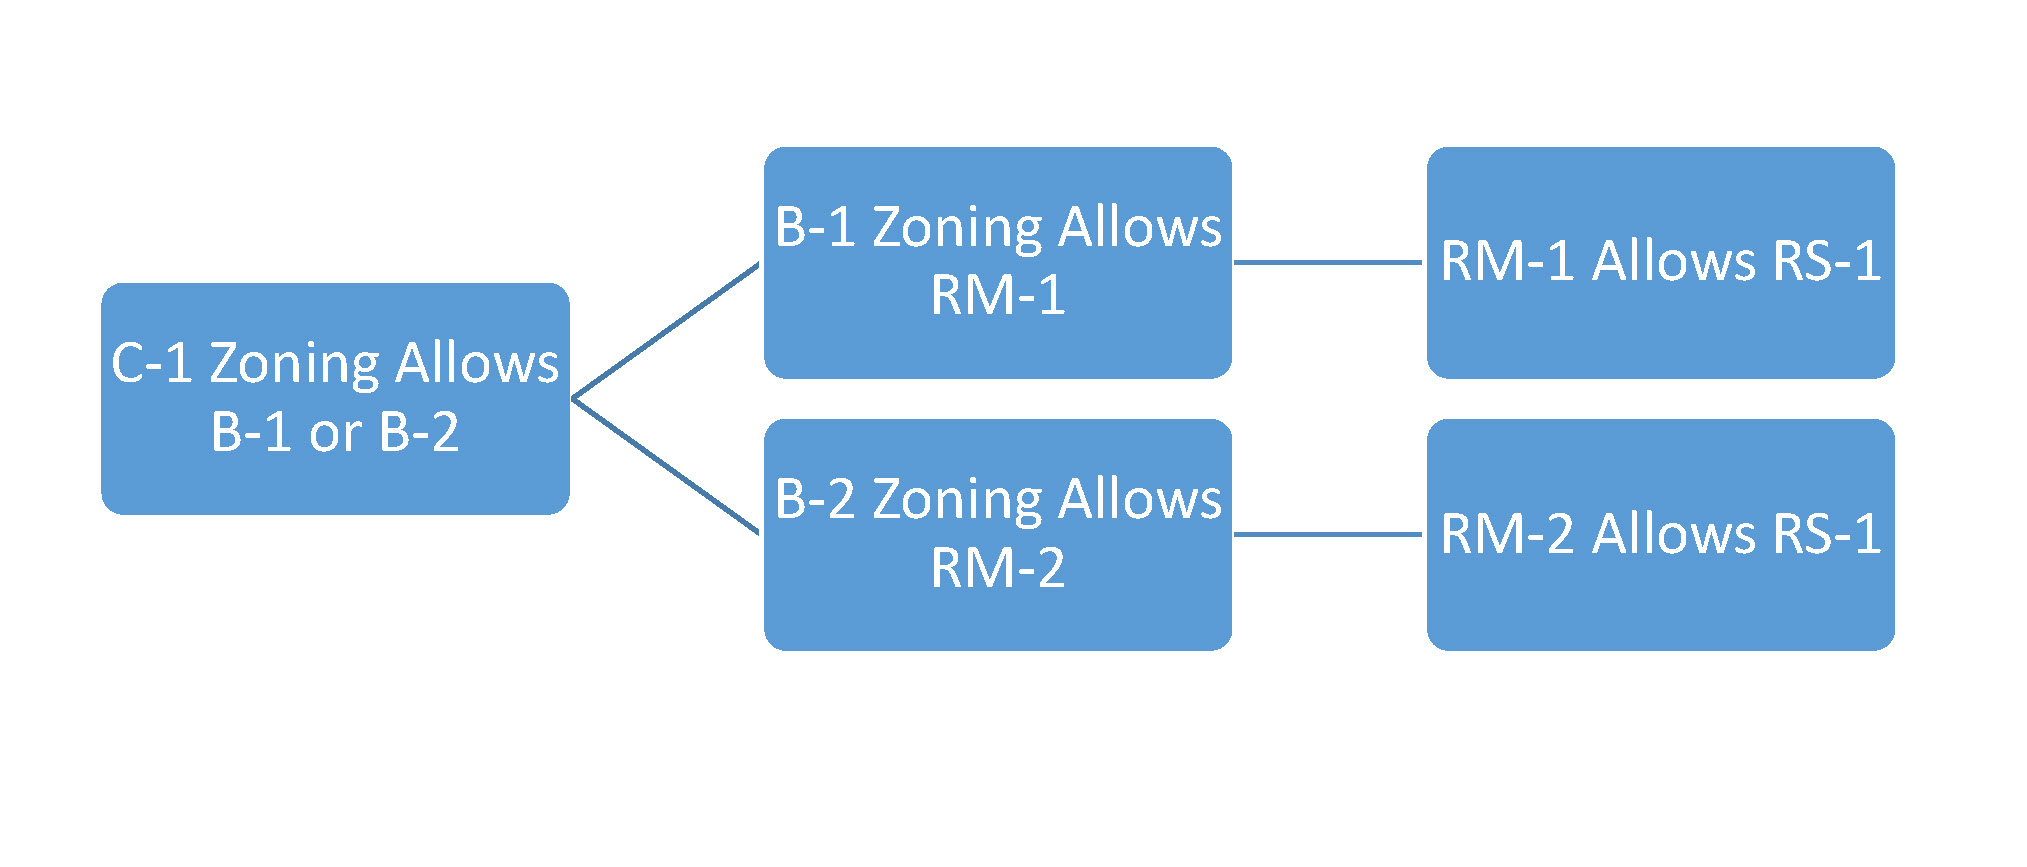
zoning code chart
Figure 1-Orleans Parish Zoning Ordinance C-1