There are 13 basic tools using technical analysis that can assist you in investing. These tools of technical analysis, combined with fundamental analysis, could give you more confidence in decision-making.
The 10 Day Moving Average Long/Short signal is designed to identify stocks that are technically sound and whose price has retraced to within 1% of its 10 day moving average. This condition is typically a good entry point since it represents a situation where by a stock is in a short term up trend and has retraced back to an area which represents the average price paid for the stock over the preceding ten day period.
In addition to the above criteria, both the Money Flow Index and the slope of the next longer term moving average (21 Day) are incorporated into the formula. The Money Flow Index (MFI) is an oscillator that tracks the flow of money into or out of a stock. A MFI value over 80 signals an Overbought (Bearish) condition while readings below 20 are considered to be an Oversold (Bullish) condition. To confirm the stock's longer term price trend, the slope of the 21 day moving average is utilized. A Positive slope (Bullish) denotes a rising moving average while a Negative Slope (Bearish) denotes a declining moving average.
The following is a summary of the conditions necessary to generate the 10-Day Moving Average BUY/SHORT signals:
The 21 Day Moving Average Long/Short signal is designed to identify stocks that are technically sound and whose price has retraced to within 1% of its 21 day moving average. This condition is typically a good entry point since it represents a situation where by a stock is in a short term up trend and has retraced back to an area which represents the average price paid for the stock over the preceding twenty-one day period.
In addition to the above criteria, both the Money Flow Index and the slope of the next longer term moving average (50 Day) are incorporated into the formula. The Money Flow Index (MFI) is an oscillator that tracks the flow of money into or out of a stock. A MFI value over 80 signals an Overbought (Bearish) condition while readings below 20 are considered to be an Oversold (Bullish) condition. To confirm the stock's longer term price trend, the slope of the 50 day moving average is utilized. A Positive slope (Bullish) denotes a rising moving average while a Negative Slope (Bearish) denotes a declining moving average.
The following is a summary of the conditions necessary to generate the 21-Day Moving Average BUY/SHORT signals:
Stochastics is an Overbought/Oversold oscillator that compares today's price to a present window of high and low prices. This data is then transformed into a numerical range that varies between 0 and 100. Stochastic readings of 20 or less denote an Oversold condition. Values of 80 or greater signal an Overbought scenario. Stochastic indicators can either be Fast or Slow and are referred to as as Fast %K and Slow %K. Slow %K is the same as Fast %K except that it is smoothed with a simple moving average to make it less erratic.
The relative movements of each stochastic value are used to identify both Buy and Short Sale entry points. Buy Signals are generated when Fast %K is below 20 (Oversold), is increasing in value and crosses Slow %K curve from below. Short Sale Signals occur when Fast %K is above 80 (Overbought), is decreasing in value and crosses Slow %K from above.
RSI was developed by J. Welles Wilder to detect Overbought and Oversold conditions. The Index is comprised of three variables:
RSI measures the degree of strength left in a price trend. If Price has been declining and RSI drops to 30 or lower, traders should be alerted to a probable reversal of the downtrend, since momentum would appear to be losing its strength. If RSI moves above 70 as Price rises, an intermediate top is usually imminent.
Oscillator indicators such as RSI are most effective in a trading range market environment. The problem with oscillators is that stocks can enter an Overbought/Oversold area and remain in this condition for an extended period of time. Research has demonstrated that the best signals obtained from the RSI oscillator are when the stock is coming out of these extreme conditions.
Buy signals are generated when a stock's RSI value has been under 30 (oversold) and then crosses above 30. Short Sale signals are created when a stock's RSI value has been over 70 (overbought) and then crosses below 70.
CCI is a powerful technical tool that is used to identify stocks that are either at the top or bottom of their trading cycle. The CCI reflects the increase in volatility that typically occurs as a stock approaches either a short term top or bottom. As the mean price of a stock distances itself from its average mean price, the stock approaches an Overbought/Oversold area. CCI readings of -100 or less are regarded as Oversold (bullish) while readings of +100 and higher are considered to be an Overbought (bearish) condition. Once the CCI enters either of these regions, conditions exist for the short term trader to enter the market.
Although CCI signals provide excellent entry points, research has demonstrated that stronger BUY/SELL signals can be achieved by delaying entry points until the CCI retraces from an Overbought/Oversold area and crosses the zero line.
Buy signals are generated when the CCI declines below -100 and the crosses the zero line from below while Short Sale signals are produced when the CCI exceeds +100 and the crosses the zero line from above. generated a CCI-SELL signal.
The Chaikin Oscillator integrates the effect of volume and price movement when determining Buy/Sell points. It uses the product of average price for a day's trading activity and volume. The underlying premise is that as the price of a stock moves up it is under accumulation and down when under distribution. The key is that the stock's daily volume must confirm the move to be valid. The Chakin Oscillator creates a volume multiplier which increases during periods of accumulation (stock closes above its midpoint for the day) and decreases during periods of distribution (stock closes below its midpoint for the day). When all variables are taken into account, the Chaikin Oscillator has its highest values when price is increasing under heavy volume, conditions present during a healthy advance. The lowest values are generated during a price decrease under low volume.
Buy signals are generated when the Chaikin Oscillator is making new lows and the slope of the 21-day moving average is positive. Short Sale signals are created when the Chaikin Oscillator is making new highs and the slope of the 21-day moving average is negative.
A stock's moving average is the average of the closing prices over a designated period of time. The last point of a ten-day moving average is the average price that the stock closed at over the last ten trading days. The second to last point is the average close of the next most recent ten days, and so on. These points are plotted over time to form a graph representing the smoothed price movement of the stock. The fewer the number of days used in a moving average, the more sensitive the moving average will be. This is because one day's closing price will have a greater effect on an average of the closes over the last ten days than it will on an average over the last twenty-one days.
Moving average trading strategies are based on crossings of faster and slower moving average to trigger Buy and Sell signals. The logic behind this approach is that as a fast moving average crosses a slower moving average, the price trend of the stock is reversing.
Buy signals are generated when the faster moving 10-Day Moving Average crosses the slower moving 21-Day Moving Average from below. Conversely Short Sale signals are created when the faster moving 10-Day Moving Average crosses the slower 21-Day Moving Average from above.
Developed by Gerald Appel, Moving Average Convergence/Divergence Short Term (MACD-ST Cross) utilizes various exponential moving averages of a stock's closing price to generate Buy and Sell signals. Exponential moving averages assign greater weight to the most recent price data and therefore are more sensitive than simple moving averages. MACD consists of the Differential Line and the Signal Line. The Differential Line is constructed by measuring the difference between two exponential moving averages, a 12- and 26-day time period. The Signal Line is a 9-day exponential moving average of the Differential Line.
Buy signals are generated when the Differential Line crosses the Signal Line from below while Sell signals occur when the Differential Line crosses the Signal Line from above. For the Differential line to cross the Signal Line from below the difference between the 12-day and the 26-day exponential moving averages must widen (diverge). For this to occur, the shorter term moving average (12-day) must move away from the longer term moving average. The Buy signal is triggered when this divergence is sufficient enough to cause a cross of the Signal Line.
Short Sale signals are generated when the opposite scenario exists. The difference between the 12-day and the 26-day averages must narrow (converge), suggesting that the price of the stock is trending down. The signal occurs when the declining Differential Line crosses the Signal Line from above.
Moving Average Convergence/Divergence Long Term (MACD-LT Cross) was developed by Gerald Appel. MACD utilizes various exponential moving averages of a stock's closing price to generate Buy and Sell signals. Exponential moving averages assign greater weight to the most recent price data and therefore are more sensitive than simple moving averages. MACD consists of the Differential Line and the Signal Line. The Differential Line is constructed by measuring the difference between two exponential moving averages, a 38- and 78-day time period. The Signal Line is a 18-day exponential moving average of the Differential Line.
Buy signals are generated when the Differential Line crosses the Signal Line from below while Sell signals occur when the Differential Line crosses the Signal Line from above. For the Differential line to cross the Signal Line from below the difference between the 38-day and the 78-day exponential moving averages must widen (diverge). For this to occur, the shorter term moving average (38-day) must move away from the longer term moving average. The Buy signal is triggered when this divergence is sufficient enough to cause a cross of the Signal Line.
Short Sale signals are generated when the opposite scenario exists. The difference between the 38-day and the 78-day averages must narrow (converge), suggesting that the price of the stock is trending down. The signal occurs when the declining Differential Line crosses the Signal Line from above.
A stock's moving average is the average of the closing prices over a designated period of time. The last point of a ten-day moving average is the average price that the stock closed at over the last ten trading days. The second to last point is the average close of the next most recent fifty days, and so on. These points are plotted over time to form a graph representing the smoothed price movement of the stock. The fewer the number of days used in a moving average, the more sensitive the moving average will be. This is because one day's closing price will have a greater effect on an average of the closes over the last fifty days than it will on an average over the last two-hundred days.
Moving average trading strategies are based on crossings of faster and slower moving average to trigger Buy and Sell signals. The logic behind this approach is that as a fast moving average crosses a slower moving average, the price trend of the stock is reversing.
Buy signals are generated when the faster moving 21-Day Moving Average crosses the slower moving 50-Day Moving Average from below. Conversely Short Sale signals are created when the faster moving 21-Day Moving Average crosses the slower 50-Day Moving Average from above.
A stock's moving average is the average of the closing prices over a designated period of time. The last point of a ten-day moving average is the average price that the stock closed at over the last ten trading days. The second to last point is the average close of the next most recent fifty days, and so on. These points are plotted over time to form a graph representing the smoothed price movement of the stock. The fewer the number of days used in a moving average, the more sensitive the moving average will be. This is because one day's closing price will have a greater effect on an average of the closes over the last fifty days than it will on an average over the last two-hundred days.
Moving average trading strategies are based on crossings of faster and slower moving average to trigger Buy and Sell signals. The logic behind this approach is that as a fast moving average crosses a slower moving average, the price trend of the stock is reversing.
Buy signals are generated when the faster moving 50-Day Moving Average crosses the slower moving 200-Day Moving Average from below. Conversely Short Sale signals are created when the faster moving 50-Day Moving Average crosses the slower 200-Day Moving Average from above.
The original theory of On-Balance-Volume (OBV) was developed by Joseph Granville. The basic assumption underlying the method is that the marketplace is divided between "Smart Money" and the "General Public." Smart money accumulates stocks at low prices and distributes it to the general public at higher prices. The OBV technique is an attempt to uncover smart money's hidden accumulation and distribution patterns before significant price movement occurs.
OBV is computed in the following manner. If a stock closes up for the day, the total volume for that day is considered to have been Buy Induced and therefore the stock is under accumulation. Conversely, a stock that closes down for the day is regarded as having been under Sell Induced pressure and the trading activity is considered to have been distribution. The volume on Up days is totaled against the volume traded on Down days. The net is a 50 day running total of OBV, and is either a positive which is bullish (BL) or negative, a bearish (BR) condition.
Buy signals are created when OBV is positive and price has experienced a negative divergence meaning it is lower than it was when OBV previously peaked. Short Sale signals are generated when OBV is negative and price has experienced a positive divergence meaning it is higher than it was when OBV recorded a new low reading. Both of these conditions suggest a potential sling shot move in the stock as price returns to levels in line with the OBV indicator.
Relative Strength (RS) is calculated by taking a stocks price performance and comparing it to the price performance of the S&P 500 over the previous fifty days of trading. RS ratings of 1.01 or higher are positive and indicate that the stock has out performed the S&P 500 during the last 50 days. Readings of .99 or less indicates that the stock has under performed the S&P 500, a negative condition.
Buy signals are created when RS is positive and price has experienced a negative divergence meaning it is lower than it was when RS previously peaked. Short Sale signals are generated when RS is negative and price has experienced a positive divergence meaning it is higher than it was when RS recorded a new low reading. Both of these conditions suggest a potential sling shot move in the stock as price returns to levels in line with the Relative Strength indicator.
© 2013 Computrade Systems, Inc. Market Edge® and Second
Opinion® are registered trademarks of Computrade Systems, Inc.
Advanced Tools is designed for the experienced investor/trader. It consists of 3 modules: Point & Figure Analysis, Trading Systems, and Industry Group Analysis.
Point & Figure Analysis uses Point & Figure Charts to identify stocks which are breaking through Resistance(bullish) or Support(bearish) areas. This module identifies those stocks that have broken through these areas and those stocks that will break through if they trade through the Breakout Price. Point & Figure Analysis is for those traders who are thoroughly familiar with the use of Point & Figure Charts.
Trading Systems is for the advanced technicians. It is a series of technical trading systems that identify significant chart patterns. In order to properly use one of these systems, you need to be completely familiar with the technical indicators that make up the system. This is not for novices.
Industry Group Analysis provides daily analysis for 94 major industry groups. The groups are first analyzed using various Market Edge indicators to identify those groups that show favorable/unfavorable market conditions. The individual stocks that make up the group are then reviewed using Second Opinion for buy/short decisions. The purpose of this analysis is to identify those stocks in the groups that are leading the industry. Studies have shown that when an Industry group moves, the entire group tends to move in concert, with certain stocks in the group outperforming the remaining stocks.
To properly use Industry Group Analysis, the investor/trader must have superior discipline in that there are very few independent decisions to make once a group has been identified. The user must stick to the list of stocks in the group and not add stocks he thinks may be similar.
Market Letter consists of three proprietary market timing models; the Cyclical Trend Index (CTI), the Sentiment Index and the Momentum Index.
Cyclical Trend Index (CTI): The CTI is based on a technical application known as Cyclical Analysis. The underlying premise of Cyclical Analysis is that the market, as measured by the Dow Jones Industrial Average (DJIA), tends to move in cycles that often resemble sine waves, a basic cycle which determines much of the motion in the universe. The utilization of sine waves in market forecasting is based on studies that demonstrate that stocks, and in particular the DJIA, tend to experience price reversals at anticipated time intervals. These intervals, referred to as cycles, consist of the price movement of the DJIA from a significant Low to an identifiable High, followed by a retreat to a recognizable Low. Cyclical Analysis systematically determines the beginning and ending points of these various cycles enabling the user to accurately time purchases and sales for maximum profit. To picture how these cycles influence price direction, visualize the stock market as a piece of elastic that is constantly subjected to positive or negative forces that exert pressure in the same or opposite directions. These forces are the five cycles that are incorporated in the CTI. The following table classifies each Cycle by its average time duration:
| Cycle | Average Time Duration | A | 6 weeks (+or-) 2 weeks | B | 18 weeks (+or-) 3 weeks | C | 36 weeks (+or-) 5 weeks | D | 72 weeks (+or-) 10 weeks | E | 216 weeks (+or-) 32 weeks |
Ideally, each cycle exerts upward pressure at the beginning of its time frame and continues to do so until it is one-half completed. At this point, the process is reversed resulting in negative pressures being applied to the market. When dealing with five cycles, the picture can become confusing. Two cycles may be in an up posture, while one may be flat, and the remaining two may be pointing down. In order to have a collective positive or negative picture of the state of the market, each cycle must be evaluated in such a way as to total their independent, positive or negative forces. This is done by assigning each cycle either a positive or negative numerical value based upon the amount of time that has elapsed since it's previous bottom. The sum of these + or - values is called the Cyclical Trend Index (CTI). This indicator reduces the cyclical status of the market to an absolute, numerical value. Readings of +1 to +21 indicate a Bullish trend in the market, whereas a 0 to -21 value signals a downward, Bearish scenario.
A major problem that can arise when employing Cyclical Analysis in forecasting the market is the determination of starting points for the various cycles. Errors in assigning an accurate count can lead to aborted readings and adverse results. This problem can occur when identifying a cycle's low and is most pronounced when more than one of the cycles are due to make a bottom. In order to rectify this problem, both a Momentum Index and a Sentiment Index have been developed and are used in conjunction with the Cyclical Trend Index to refine the Market Timing Model.
Momentum Index: The Momentum Index is designed to measure market divergence by comparing the performance of eight, non-Dow Jones Industrial Average Indices to that of the Dow Jones Industrial Average. Divergence is a technician's term that measures whether the DJIA is performing better or worse than the majority of the other market indices. Whenever the DJIA goes its own way for a period of time, whether up or down, a market turn is usually at hand. Typically, negative divergence (DJIA is up while broader indices are trending down) exists at significant market tops, while positive divergence (DJIA is down while broader indices are trending up) indicates a market bottom.
Momentum Index::...................................................+3 Bullish
| Indicators | Current Reading | Connotation |
| Dow Jones Industrial Averages (DJIA) | 11005.37 | |
| Dow Jones Transportation Average | 2929.20 | NEGATIVE |
| S&P 500 Index | 1277.9 | NEGATIVE |
| NYSE Composite Index | 647.13 | NEUTRAL |
| NYSE Advance-Decline Line | -58859 | POSITIVE |
| 10 Day MA Advance-Decline Line | 1.21 | POSITIVE |
| AMEX Index | 936.04 | POSITIVE |
| NASDAQ Composite Index | 2251.06 | NEGATIVE |
| DJ Utilities Index | 390.07 | POSITIVE |
| Trin (5 Day Average) | 1.34 | NEUTRAL |
| NYSE New High-New Lows | 511-48 | POSITIVE |
| Zweig Breadth Indicator | 0.46 | NEGATIVE |
| McClellan oscillator | -1 | NEGATIVE |
| McClellan Summation Index | 2879 | NEGATIVE |
| Unchanged Issue index | 0.07 | NEUTRAL |
Included in the Index are four additional indicators that measure the market's positive or negative breadth & momentum. An explanation of these indicators follows.
Zweig Breadth Indicator divides the number of NYSE advancing issues by the sum of the NYSE advancing and declining issues. Readings above .6 are regarded as Bullish while levels below .4 are Bearish.
McClellan Oscillator measures the difference between the number of NYSE advances and declines over a 19-day period subtracted from the number of advances and declines over a 39-day observation. This indicator is regarded as Bullish when it drops below zero and is Bearish when above zero.
TRIN 5-Day Average is computed by dividing the ratio of NYSE advancing issues to declining issues by the ratio of advancing issue volume to declining issue volume. Market Edge calculates a ten-day moving average of this index. Values above 1.24 are Bullish, while values below .75 are Bearish.
Unchanged Issue Index is calculated by dividing the number of NYSE unchanged issues by the total number of NYSE issues traded. Readings less than .186 are Bearish, while readings greater than .22 are Bullish.
Sentiment Index: The Sentiment Index, which measures the degree of optimism or pessimism prevalent in the market, is an important indicator when attempting to determine he market's future direction. Market Edge tracks nine technical indicators that measure excessive speculative or sentiment conditions prevalent in the market.
Sentiment Index . . . . . . . . . . . . . . . . . . . . . . . . . . +3 Neutral
| Indicators | Current Reading | Connotation |
| Odd Lot Short Ratio (5 Day Avg.) | 5.24 | BEARISH |
| NYSE Short Interest Ratio | 4.80 | BULLISH |
| Public-Specialist Short Ratio | 0.36 | NEUTRAL |
| Put/Call Ratio (5 day Avg.-Index Options) | 1.40 | BULLISH |
| Dividend Yield Spread | 5.56 | NEUTRAL |
| Mutual Fund liquid Asset Ratio | 5.80 | BULLISH |
| Bullish Investment Advisors | 47.9 | NEUTRAL |
| Bearish Investment Advisors | 35.4 | NEUTRAL |
| Bearish + Corrections Total | 52.1 | NEUTRAL |
| VIX (CBOE Volatility Index) | 22.9 | NEUTRAL |
Sentiment based technical indicators are:
| Indicators | Current Reading | Connotation |
| Odd Lot Short Ratio: The number of Odd Lot shares sold short divided by the total number of Odd Lot sales. | +10 - +50+.06 - +.09+.00 - +.05 | BULLISH NEUTRAL BEARISH |
| NYSE Short Interest Ratio: The number of shares sold short on the NYSE divided by the average monthly trading volume. | +3.5- +9.0+3.0 - +3.5+0.0 - +3.0 | BULLISH NEUTRAL BEARISH |
| Public-Specialists Short Ratio: The number of NYSE shares sold short by the public divided by the # of shares sold short by the specialist. | +.60 - UP+.36 - +.59+.00 - +.35 | BULLISH NEUTRAL BEARISH |
| Put-Call Option Ratio: A ten day moving average of the number of Index Put options purchase divided by the number of Index Call options purchased. | +1.70 - UP+1.00 - +1.69+.00 - +1.00 | BULLISH NEUTRAL BEARISH |
| Dividend Yield Spread: The relationship between the average NYSE dividend rate and the yield on thirty-year Treasury bonds. | +3.00 - +5.75+5.75 - +6.75+6.75 - +9.99 | BULLISH NEUTRAL BEARISH |
| Mutual Fund Liquid Asset Ratio: The ratio of mutual fund cash to total assets. | +11% - +20%+09% - +10%+00% - +08% | BULLISH NEUTRAL BEARISH |
| Bullish Investment Advisors: The percentage of newsletter writers who are Bullish on the market as measured by Investors Intelligence. | +00% - +40%+41% - +54%+55% - +99% | BULLISH NEUTRAL BEARISH |
| Bearish Investment Advisors: The percentage of newsletter writers who are Bearish on the market as measured by Investors Intelligence. | +50% - +99%+21% - +49%+00% - +20% | BULLISH NEUTRAL BEARISH |
| Bearish + Corrections Total: The total percentage of newsletter writers who are either Bearish or forecasting a correction for the market as measured by Investor Intelligence. | +00% - +29%+30% - +69%+70% - +99% | BULLISH NEUTRAL BEARISH |
Each indicator is assigned a positive, negative or zero value depending on whether its reading is deemed to be Bullish, Bearish or Neutral. The sum of these values is referred to as the Sentiment Index. Plus 3 to plus 11 readings are Bullish, while minus 1 to minus 11 readings are Bearish.
Is Jack Welch right in his claim the 7.8% #unemployment numbers released on October 5 by the Bureau of Labor Statistics are suspect? The numbers show there are 133,500,000 nonfarm workers employed as of September 2012. There are actually two surveys performed, one is called the Household Survey which is also reported as the Adjusted Household Survey ( smoothed for population control revisions) and the second survey is called the Payroll Survey. Over the last 12 years, the percent of workers unemployed is still near its highest level at 40%, down from 45% but well above the 10% number in the 1990 recession.
The most telling number and what Jack Welch, ex-CEO of General Electric, can't reconcile with the 7.8% number is the labor force participation rate at 63.5% which is at a 12 year low, down from a high of 67% in 1999, and a steep drop from the 2008 labor participation rate of 66%.
The employment to population ratio is a 12 year low of 59%, down from a 1999 high of 65%, and not all employment sectors have responded equally to the recent economic cycle, with construction, information and government jobs negative over the last 2 years.
The largest decline was a 470,000 job loss in the government sector since February 2010. The largest employment gains were 1,414,000 in professional and business services and 1,015,000 in health care, followed by 746,000 in hospitality over the last 2 years. Not all races have responded equally since the 2008 recession with african american unemployment at 13.4% and 16 to 24 year old unemployment at 15.5% as of September 2012. There is also an 8 year high of people not in the labor force at 2,500,000, called marginally attached, and a 12 year high of involuntary part time employment of 8,000,000 workers, up from a 1999 low of 3,000,000 workers.
Click this link for the full explanation and PowerPoint presentation by the Bureau of Labor Statistics: BLS employment explanation.
Sources: Department of Commerce, Census Bureau, Thomas Nardone, Associate Commissioner for Employment and Unemployment Statistics at the Bureau of Labor Statistics.
copyright www.louisianacommercialrealty.com, new orleans commercial real estate.
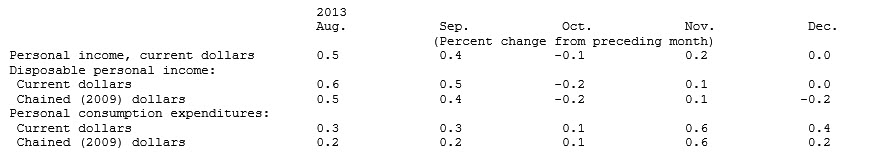
The growth rate of the economy is slowing, according to the latest figures released from the Bureau of Economic Analysis. Back in August 2013, personal income grew at .5% and then is September grew at .4% but then in October, November, December started to wane with December's growth less than .1 percent. This means we should prepare for a slower growth economy and possibly a stagnant one to come over the next 12 months.
Personal income increased $2.3 billion, or less than 0.1 percent, and disposable
personal income decreased $3.8 billion, or less than 0.1 percent, in
December according to the Bureau of Economic Analysis. Personal consumption
expenditures increased $44.1 billion, or 0.4 percent. In November,
personal income increased $29.8 billion, or 0.2 percent, DPI increased $14.4
billion, or 0.1 percent, and PCE increased $74.8 billion, or 0.6 percent, based
on revised estimates.
The total supply of commercial real estate for sale in New Orleans is approximately $726,000,000 with vacant land being the largest sector valued at almost $242 million, followed by office property valued at $175 million.
There are two databases that house information on most of the commercial property for sale in the New Orleans area. The largest, Loopnet.com, claims to have 3,000,000 registered users nationally who spend an average of twenty minutes searching through 640,000 listings.
LACDB.com is the other database, a Louisiana host for the Catylist Network, which claims access to 100,000 commercial agents nationally and is used by approximately 800 Louisiana commercial real estate agents. Most commercial agents make sure their property for sale is listed in both databases, and some also use the MLS database to increase visibility to residential agents. LACDB.com provides data on the actual sale price of properties which can be compared to the original list price of properties to provide useful information on the actual value of commercial real estate.
This price trend is determined by a variance, called the Demand/Supply Gap. For example list prices for warehouses ranged from $10-$20/sf in New Orleans East to $60-$70/sf in Elmwood, but averaged $35 per square foot overall. Since actual sale prices averaged $26 per square foot, sellers were willing to accept 31% less than originally expected. This gap is a measure of strength or weakness in a market. As shown in Table One and the Supply/Demand Gap Chart, retail sector prices had to fall 34% before buyers were interested.
| Listed | Actual | Variance | |
| Industrial | $35.06 | $26.85 | -31% |
| Office | $72.93 | $67.89 | -7% |
| Shopping Center | $60.37 | $71.87 | 16% |
| Retail-Commercial | $94.25 | $70.36 | -34% |
| Multi Family | $50.19 | $56.92 | 12% |
In the New Orleans MSA, which includes Metairie and Kenner, there is a higher supply of land, office, retail and industrial property versus any other sector, but the average price of land for sale is $1.1 million compared to the average shopping center priced at $2.2 million. The total market of commercial real estate for sale totals $726 million.
Table Two: Value of Commercial Sectors In New Orleans MSA |
||
| Property Type | Total Value | Listed |
| Industrial | $94,481,600 | 77 |
| Office | $175,583,362 | 115 |
| Shopping Center | $33,500,140 | 15 |
| Retail-Commercial | $122,664,722 | 123 |
| Vacant Land | $242,866,435 | 221 |
| Multi Family | $57,094,550 | 53 |
| TOTAL | $726,190,809 | |
COPYRIGHT 2012, www.louisianacommercialrealty.com. / orig.pub.jan. 2009.
Commercial real estate in New Orleans is often valued incorrectly which can be a disaster, but it also creates opportunity: big money is made when you understand how to value commercial real estate correctly. This article examines three basic mistakes anyone can make when valuing commercial real estate.
The first mistake commercial real estate buyers and sellers make is to depend on appraisals, whose main function is to finance the property by allowing a bank committee to say they used a logical process to make a loan to purchase the property. The appraisal value is not the same as the market value and here's why: the appraisal looks at past sales and corrects for physical differences. Makes sense but the past is not the future. The basic assumption in all appraisals is that it assumes that the past sales that took place between a willing buyer and seller would repeat themselves. In reality, commercial real estate is always purchased by a buyer who has a specific use for that specific property and may not have the same use for an additional property even though it is similar. Often commercial real estate buyers will value a property because they can generate a certain cash flow from a business on that property. We cannot assume a nearby property has the same valuation for two reasons:
A good example of a useless appriasal was the purchase of a 40,000 square foot of land at 1667 Tchoupitoulas in New Orleans in June 2006 for $1.1 million, based on an appraisal and financed by Gulf Coast Bank. The buyer was unsuccessful in flipping the property and put it back on the market for sale, eventually giving it back to the bank who sold the property in December 2011 for $600,000 to Infiniti Fuels who will build a convenience store on the site.
The second big mistake made in valuing commercial real estate is to depend on the last sale price. Often a seller believes that the market value of property is what he paid for it plus some carrying cost. Psychologically this is called "benchmarking". In reality, the market price is what a willing buyer would pay for it, which is more accurately predicted by what other properties match his needs. This is called the "Law of Substitution", because any buyer will ask themself, "Why should I pay one million for your property when I can get the same property down the street for $750,000?" One excellent way to determine market value is to research what other properties are selling for.
The third mistake in valuing property is not understanding "Opportunity Cost" which is the unit of some commodity "A" given up in order to obtain the same amount of commodity "B". By overvaluing commercial real estate, a property could sit unsold for several years, resulting in the owner losing the opportunity to invest those proceeds in another property, or the stock market, or give to grandchildren to pay for a college education. Smart commercial property owners understand a financial ratio called "Return on Assets", which is your property's net income divided by the value of the asset. With commercial real estate, your return is the rental income plus capital gain and property is often held several years. If you buy land for one million and forego the opportunity to sell the property for $1.5 million in 5 years because you think the property is worth 2 million, you might get your price but it might take you another 5 years to do so and your return on your asset would be 6.95% per year, not including taxes and insurance and time and property management expenses. Had you sold the property for less at $1.5 million in a shorter period of time of 5 years, your return on assets would have been 8.13% per year. Really smart commercial property owners not only know the return on assets but compare all their investments and allocate resources to the investments that have the highest return on assets with some adjustment for risk. In financial economics this is called riding the "Efficient Frontier", and it works for Mark Cuban and can work for you too.
Louisiana will be exploding with growth over the next 5 years, considering the incentives offered for businesses. For example, there is a 25% tax credit that can be sold for digital media expenditures. That is a dollar-for-dollar tax credit. There is a 50% bonus depreciation and tax exempt financing at a 2% interest rate. There is a tax credit for live performances up to 25% of expenditures. There is a tax credit of 30% which can also be sold on movie expenditures. There is a 39% federal plus a 25% state New Market Tax Credit for development in low income areas.There is a 25% tax credit for Sound Recording expenditures. We need to get the word out, and here are 14 major incentives and a summary of benefits all in one list.
14 Major Business Incentives Louisiana Offers
1. The Digital Media Incentive provides a tax credit of 25% of qualified production expenditures for state-certified digital interactive productions in Louisiana and 35% tax credit for payroll expenditures for Louisiana residents.
2. Economic Development Award Program assists publicly owned infrastructure for industrial or business development projects that promote targeted industry economic development and that require state assistance for basic infrastructure development.
3. The Enterprise Zone (EZ) program is a jobs incentive program that provides Louisiana income and franchise tax credits to a business hiring at least 35% of net new jobs from one of four targeted groups. EZs are areas with high unemployment, low income or a high percentage of residents receiving some form of public assistance. A business must create permanent net new jobs at the EZ site. A business is not required to be located in an EZ. A business does not have to invest money, only create additional jobs.
OR
4. The Gulf Opportunity Zone Act of 2005 (GO Zone) provides federal and state tax incentives for business development in parishes most affected by hurricanes Katrina and Rita.
5. The Industrial Tax Exemption (ITE) Program provides property tax abatement for up to 10 years on a manufacturer's new investment and annual capitalized additions. This exemption applies to all improvements to the land, buildings, machinery, equipment and any other property that is part of the manufacturing process.
6. The Live Performance Tax Credit program offers a fully transferable tax credit that can be sold or applied against Louisiana tax liability. Tax credits received for infrastructure cannot exceed $10 million per project and are also subject to a $60 million annual cap. There is no annual cap on the production credits. The tax credit value increases with higher levels of certified expenditures, as outlined below:
In addition to the baseline tax credits for live performance production and infrastructure, the producer may also qualify for additional incentives, including:
7. Mentor-Protégé Tax Credit program enhances Louisiana's business environment for new construction companies. This program provides technical and economic benefits to Louisiana-based contractors who will create and/or retain jobs for Louisiana citizens, expand the state's economy and increase available quality jobs.
8. The Modernization Tax Credit program provides a 5% refundable state tax credit for manufacturers making capital investments to modernize or upgrade existing facilities in Louisiana.
9. The Motion Picture Industry Development Tax Credit provides a 30% tax credit on qualified motion picture expenditures with no project or program caps. Payroll expenditures for Louisiana residents qualify for an additional 5% tax credit (35% effective total credit rate).
10. The New Markets Tax Credit program encourages investment in urban and rural low-income areas to help finance community development projects, stimulate economic growth and create jobs.
Private-sector investors receive credit against federal income taxes. The program allows individual and corporate taxpayers to receive a credit against federal income taxes for making qualified equity investments in Community Development Entities, or CDEs. Credits can be obtained every year the investment is held, for up to seven years of the credit period.
11. The Quality Jobs (QJ) program provides a cash rebate to companies that create well-paid jobs and promote economic development.
OR
12. The Research and Development Tax Credit encourages existing businesses with operating facilities in Louisiana to establish or continue research and development activities within the state.
13. The Restoration Tax Abatement (RTA) program provides five-year property tax abatement for the expansion, restoration, improvement and development of existing commercial structures and owner-occupied residences.
14. The Sound Recording Investor Tax Credit program rebates a 25% refundable tax credit for qualified production expenditures for state-certified sound recording projects.
Source: Louisiana Economic Development Foundation
Kenner is like most zoning authorities in that they want to spell out in zoning ordinances exactly what is allowed, such as areas for blacksmithing, macaroni making, manufacturing of looseleaf paper, thermometers and wire brushes. Zoning codes also detail some silly permitted uses. This article compares the industrial zoning codes and clears up the confusion.
Kenner, Louisiana, has its own zoning ordinance-separate from Jefferson Parish. The three main industrial zoning codes are Light Industrial, Heavy Industrial Zoning, and also the Special Industrial Zoning Code. Kenner was developed in the late 1960's as residential and commercial growth expanded from Metairie and today the area has a population of 245,000.

Kenner Boundaries
The Kenner Warehouse Market is considered part of the larger suburban Jefferson Parish Sub-Market within the New Orleans Metropolitan Area. The suburban Jefferson Parish Sub-Market (±26,651,960 rentable square feet in 920 buildings) is divided into three sub-areas: Elmwood (±20,203,566 rentable square feet in 541 buildings), Kenner (±4,286,170 rentable square feet in 237 buildings), and North Metairie (±2,162,244 rentable SF in 142 buildings).
A survey conducted by The Real Estate Market Data Center & Center for Economic Development of the University of New Orleans in the first quarter of 2012 includes the following:

kenner industrial space for lease market share
Since Kenner has older industrial areas that grew out of nearby residential areas, the Special Industrial Zoning requires industrial businesses to make their sites attractive so they don't conflict with nearby residential properties. There is no storage allowed in the front yard, and a landscaped front yard of 20 feet is required. Permitted uses can be commercial as well as industrial, but the only two businesses with detailed restrictions are cocktail lounges and adult bookstores.. Signs must be a maximum of eight square feet and less than 30 feet high and buildings have a maximum height of 75 feet. There is no difference in parking and loading zone requirements however.
Zoning of Light Industrial areas still require uses to be controlled to make them compatible with nearby residential districts, and you still need a 20' yard, but storage outside is not restricted. Uses detailed in the zoning ordinance allow industries not seen in Louisiana in 75 years, but its good to know you can manufacture boots, looseleaf paper, watches, thermometers, wire brushes and macaroni (with city council approval). These specific industries in the zoning code must be a result of some very fine lobbying by someone long forgotten. The room for interpretation tends to slow down the permitting process, making development more expensive, which results in older structures not being put to their highest and best use. The end result is a lower tax base and less resources for schools and government services.
This zoning looks out for itself, with no regard to residential consideration. The purpose is to provide for all types of industrial uses, with the only detailed use not allowed being hazardous and obnoxious industries. Any use in the Light Industrial Zoning is also permitted except for residences. Specifically mentioned in this zoning code are permitted uses for cigar manufacturing (useful during WW2), junk yards, barge terminals and macaroni manufacturing (again). Buildings may have a height of 100' and now require a 30' front yard. The requirements for parking and loading are no more stringent than for Light Industrial and Special Industrial.
COMPARISON OF KENNER ZONING CLATEGORIES |
|||
| S-I Special Industrial | L-1, Light Industrial | H-1, Heavy Industrial | |
| Purpose | The purpose of this district is to provide sufficient space in appropriate locations for certain types of business and manufacturing relatively free from offense, in modern landscaped buildings and to make available more attractive locations for these businesses and industries. This district provides a transition area between associated land uses. Residential uses are excluded, except for overnight facilities for watchman and/or caretaker employed on the premises. | The purpose of this district is to provide for a wide variety of light manufacturing, fabricating, processing and other uses appropriately located near major streets or railroads for access and to control operations of industrial uses under such conditions to make them compatible with nearby commercial or residential districts. Residential uses are excluded, except for overnight facilities for watchman and/or caretaker employed on the premises | The purpose of this district is to provide for industrial operations of all types except that certain potentially hazardous or obnoxious industries are prohibited. Residential uses are excluded, except for overnight facilities for watchman and/or caretaker employed on the premises. |
| Permitted Uses | Upon council approval as per section 23.02, any use permitted in a C-2 District, except that cocktail lounges shall be located at least two hundred (200) feet from any residential property. Adult Bookstores upon city council approval. | Any use permitted in a S-I Special Industrial District. Truck Stop. Adult Bookstore. Boots, Looseleaf paper, macaroni on city council approval, watches, thermometers, wire brushes, etc. | Any use permitted in a L-I Light Industrial District except for residential dwellings. Adult Bookstores, blacksmiths, cigar manufacturer, macaroni manufacturer, junk yards, barge terminals. |
| Special Requirements | Landscaped front yard. | Hazardous or obnoxious uses and must be approved by the city council. | |
| No storage of materials in front yard. | |||
| Signs | Nonilluminated accessory signs as permitted in the RR-3 District except maximum height shall be thirty (30) feet above ground. | Signs max 35' high, as permitted in the C-2 District, except adult book/video stores and massage parlors which are not allowed to have descriptive art. | Signs max 35' high, as permitted in the C-2 District, except adult book/video stores and massage parlors which are not allowed to have descriptive art. |
| Height Restrictions | Maximum of 75'. | Maximum of 75'. | Maximum of 100'. |
| Yard Restrictions | |||
| Front | 20' | 20' | 30' |
| Side | None required unless abuts residential, then 10'. | None required unless abuts residential, then 10'. | None required unless abuts residential, then 10'. |
| Rear | None required unless abuts residential, then 20'. | None required unless abuts residential, then 20'. | None required unless abuts residential, then 20'. |
| Lot Area | 5,000sf | 5,000sf | 5,000sf |
| Loading Zone Requirements | Provided in Article XVIII. Warehouses require 1 space for each employee on the largest work shift plus 1 space for each company vehicle operating from the premises, 3 spaces minimum total | Provided in Article XVIII. Warehouses require 1 space for each employee on the largest work shift plus 1 space for each company vehicle operating from the premises, 3 spaces minimum total | Provided in Article XVIII. Warehouses require 1 space for each employee on the largest work shift plus 1 space for each company vehicle operating from the premises, 3 spaces minimum total |
| Off-Street Loading | 2,000sf-10,000sf requires one loading space, 10,000sf-20,000sf requires two, 20,000sf-40,000sf requires 3, 40,000sf-60,000sf requires 4, one additional for every 50,000sf over | 2,000sf-10,000sf requires one loading space, 10,000sf-20,000sf requires two, 20,000sf-40,000sf requires 3, 40,000sf-60,000sf requires 4, one additional for every 50,000sf over | 2,000sf-10,000sf requires one loading space, 10,000sf-20,000sf requires two, 20,000sf-40,000sf requires 3, 40,000sf-60,000sf requires 4, one additional for every 50,000sf over |
| Article 3, Appendix A-Zoning, Kenner Code of Ordinances | |||
| Yard: An open space other than a court at existing ground level between a buildable area and the adjoining lot lines, unoccupied and unobstructed by any portion of a structure from the ground upward except as otherwise provided herein. For the purposes of determining yard measurements, the least horizontal distance between a lot line and the buildable area shall be used. | |||
| Yard, front: A yard extending across the front of a lot between the side yard lines, and being the required minimum horizontal distance between the street line and the maximum permissible main building. On corner lots the front yard shall be considered as parallel to the street upon which the lot has its least dimension. | |||
copyright 2013, Louisiana Commercial Realty, LLC