
Over the last 12 months ending December 2018, inflation, that secretive economic thief that steals your purchasing power, increased 2.2%, continuing to drive the wage price spiral like grandma through a slow school zone, keeping pay raises low and interest rates at the lowest levels in decades. The fat cat donor to this economic bipartisan party has been a decline in energy prices, offsetting the rise in food items, housing and medical care.
Low inflation benefits those who buy assets and borrow money but hurts savers, retirees and those who already own their assets. Just because the Consumer Price Index says inflation is low, it doesn’t mean the cost of medicine and food are any less expensive for senior citizens. Let’s first examine the various ways of measuring inflation, its history and how it impacts our daily life.
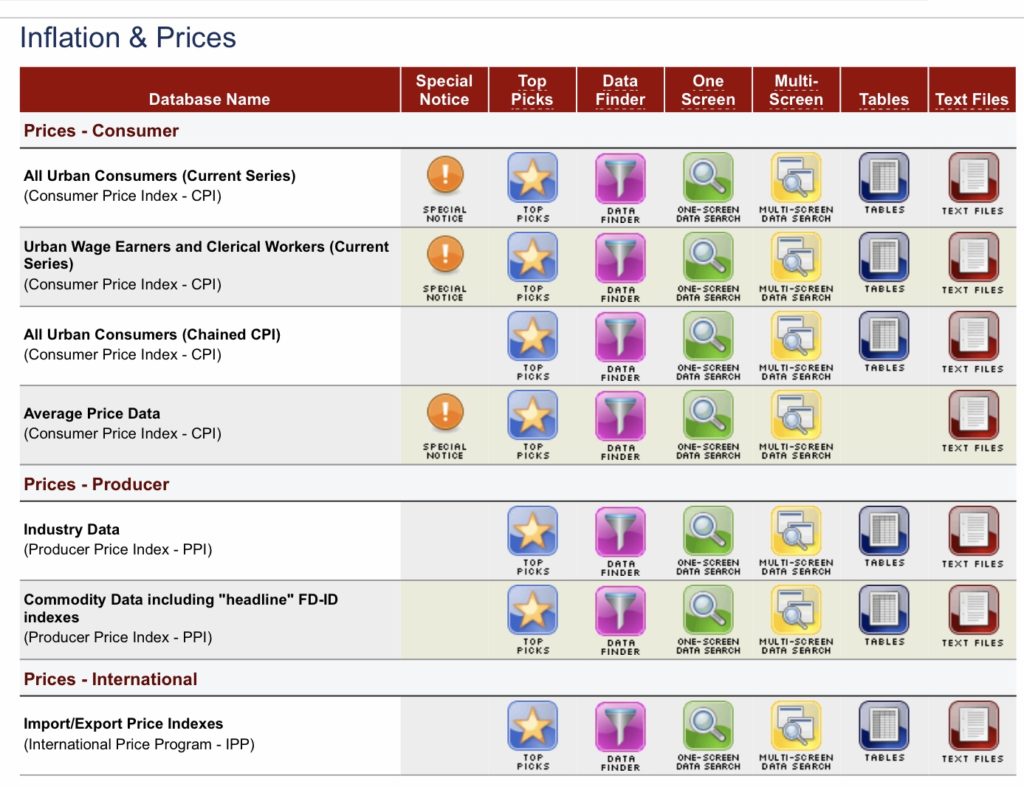
The most widely quoted inflation number is called the All Urban Consumers Current Series, but there are 4 other methods of determining inflation and two variations of each. For example, one method is the Urban Wage Earners, another is called the All Urban Consumers and there is also the Average Price Data. There are different base years where measuring started and each gives a different number. There is a method called chained that provides a different result, and some data is adjusted for seasons and other data is not. The first data out is not seasonally adjusted so it is the most commonly quoted. There’s more: in addition to measuring consumers, there are also measures of producers who sell to consumers.
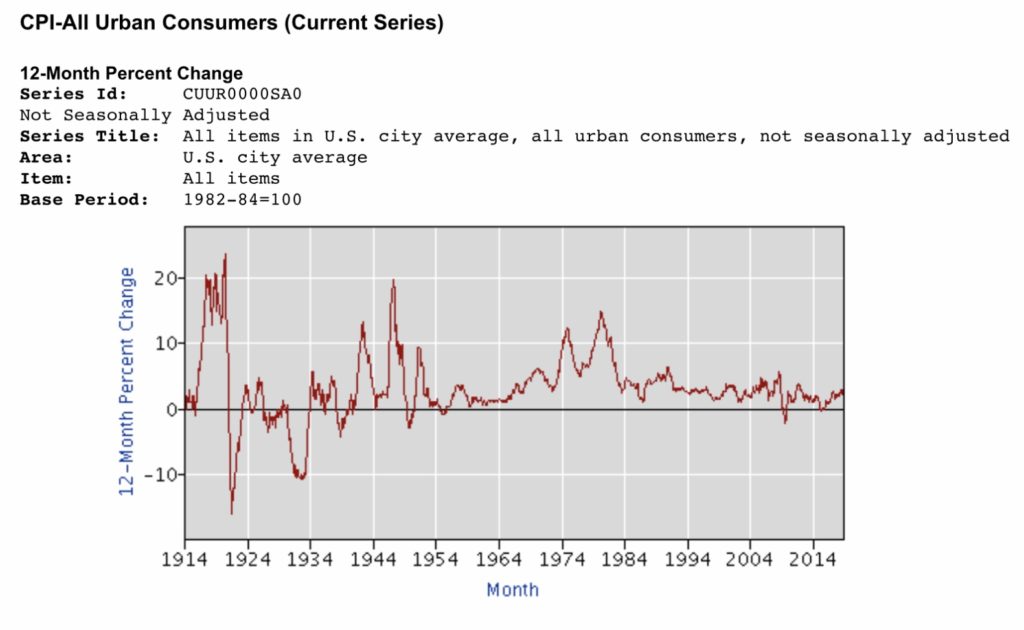
Let’s examine the history of inflation to see what the future holds. Inflation from 1914 to 1990 fluctuated widely, causing interest rates to track with high standard deviations and several recessions, depressions, booms and busts. All this changed when OPEC banded together and raised oil prices in the 1970’s causing the peaks in the above inflation chart skyrocketing over 10%, resulting in President Ronald Reagan threatening to fire the striking Air Traffic Controllers to break the wage/price spiral in the 1980’s. It worked. Unions never recovered their power to secure high wage increases and inflation and interest rates plummeted.

After periods of 10% inflation devastating the economy, the 1990’s welcomed inflation under 5% and, except for the mortgage crisis in 2008, the economy enjoyed steady growth and inflation never rose above 5%. The mortgage crisis was a wringing out of the excesses of the 2000’s when President Bill Clinton spurred home ownership and HUD, Fannie Mae and Freddie Mac loaned money freely to purchase homes, increasing home ownership to its highest levels and making Clinton very popular.
With the breaking of union power and the wage/price spiral, inflation has remained low, under 5%, for decades. This is a strong undercurrent that drives our economy, like a large oil tanker making its way down the Mississippi River-it takes a long time to change its path. This means the future will tend to be more of the same: slow GDP, low inflation, low interest rates but difficulty for businesses to grow by raising prices. The only way to get bigger is to vertically integrate or be creative by developing new products that capture market share.