Of those that own commercial real estate, there are more assets in rental property than in IRA's, 401(k)'s and the median net worth of Americans. In the 2010 census, Americans were asked where they invested their money. Of the 118.554 households , the largest category of asset was the Interest Earning Account at a Financial Institution, with 69.8% of the households investing in that category. The second highest category was asset was a home at 65.9% of the households, as seen in the table below:
TOTAL |
|
Number of Households (thousands) |
118,554 |
| Interest Earning Assets at Financial Institutions | 69.8 |
| Other Interest- Earning Assets | 3.0 |
| Regular Checking Accounts | 28.4 |
| Stocks and Mutual Fund Shares | 20.4 |
| Own Business or Profession | 13.9 |
| Motor Vehicles | 83.9 |
| Own Home | 65.9 |
| Rental Property | 5.2 |
| Other Real Estate | 5.0 |
| Mortgages | 0.7 |
| U.S. Saving Bonds | 10.3 |
| IRA or KEOGH Accounts | 29.4 |
| 401K & Thrift Savings Plan | 42.0 |
| Other Assets | 3.7 |
The bar chart below shows what percent of households own various assets, using the data from the table:
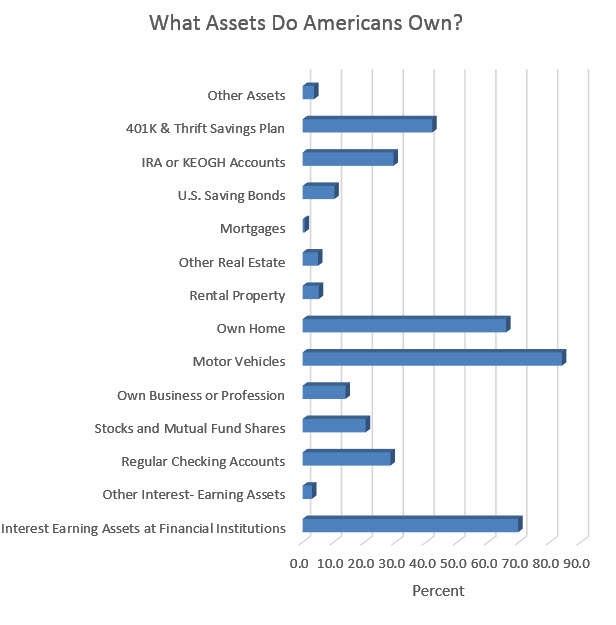
chart of assets
The value of the assets tell a different story, with the median value of assets in 2010 for the average American resulting in a net worth of $66,740, but only $15,000 if you exclude the equity in the home, as shown in the table below. The interesting number is the median value of commercial real estate, that is, rental property is $170,000 and other than home real estate equity is $75,000. So how can the rental property equity be higher than the net worth? Both numbers are after debt is subtracted. The answer is that not everyone owns rental property, but when all the values are calculated the values of rental property are higher than other categories. There is more than 5 times the equity in commercial real estate than in the average household's IRA or 401(k).
TOTAL |
|
| Net Worth | 66,740 |
| Net Worth (Excluding Equity in Own Home) | 15,000 |
| Interest Earning Assets at Financial Institutions | 2,463 |
| Other Interest- Earning Assets | 16,528 |
| Regular Checking Accounts | 600 |
| Stocks and Mutual Fund Shares | 18,300 |
| Equity in Business or Profession | 5,000 |
| Equity in Motor Vehicles | 6,237 |
| Equity in Own Home | 80,000 |
| Rental Property Equity | 170,000 |
| Other Real Estate Equity | 75,000 |
| U.S. Saving Bonds | 800 |
| IRA or KEOGH Accounts | 30,000 |
| 401K & Thrift Savings Plan | 27,000 |
| Other Assets | 24,000 |
Americans may have been created equal, but a vast difference exists between the races, as shown in the table below. Hispanics have less than 10% of the average net worth and blacks have 5% of the average net worth, compared to Americans as a whole. The economically disadvantages the two fastest growing populations, who have realized they control their destiny by voting the Democratic Party into office since the Republican Party has ignored their needs.
Net Worth |
|
| TOTAL | 66,740 |
RACE OF HOUSEHOLDER |
|
| White Alone | 87,906 |
| White Alone (Not of Hispanic Origin) | 110,729 |
| Black Alone | 4,955 |
| Asian Alone | 69,590 |
| Other (residual) | 15,795 |
| Hispanic Origin | 7,424 |
| Not of Hispanic Origin | 82,730 |
Another conclusion from the 2010 census was the median net worth of households according to education, with the median high school drop out having a net worth of 5% of the household with a bachelor's degree. This is why we will continue to experience crime in New Orleans until we find a way to get more students through high school and into trade schools. The assets New Orleans commits to higher graduation rates will easily pay for itself.
EDUCATION OF HOUSEHOLDER |
|
| No High School Diploma | 7,270 |
| High School Graduate Only | 42,223 |
| Some College, No Degree | 43,580 |
| Associate's Degree | 58,861 |
| Bachelor's Degree | 142,518 |
| Graduate or Professional Degree | 245,763 |
NOTE: In dollars. Excludes group quarters. (B) - Base is less than 200,000 households. Individual outliers that highly influenced the mean value for asset categories were excluded. "Other Assets" includes mortgages held for sale of real estate, amount due from sale of business or property, and other financial assets. Federal surveys now give respondents the option of reporting more than one race. There are two basic ways of defining a race group. A group such as Black may be defined as those who reported Black and no other race (the race-alone or single-race concept) or as those who reported Black regardless of whether they also reported another race (the race alone-or-in-combination concept). This table shows data using the first approach (race-alone). The use of the single race population does not imply that it is the preferred method of presenting or analyzing data. The U.S. Census Bureau uses a variety of approaches. Because Hispanics may be any race, data in this table for Hispanics overlap slightly with data for the Black population. Data for American Indians and Alaska Natives are not shown because of their small sample size. The race or Hispanic origin of the householder designates the race or Hispanic origin of the household. The estimates in this table are based on responses from a sample of the population and may differ from the actual values because of sampling variability and other factors. As a result, apparent differences between the estimates for two or more groups may not be statistically significant. For information on sampling and nonsampling error see: http://www.census.gov/sipp/source.html
Source: U.S. Census Bureau, Survey of Income and Program Participation, 2008 Panel, Wave 7; www.louisianacommercialrealty.com
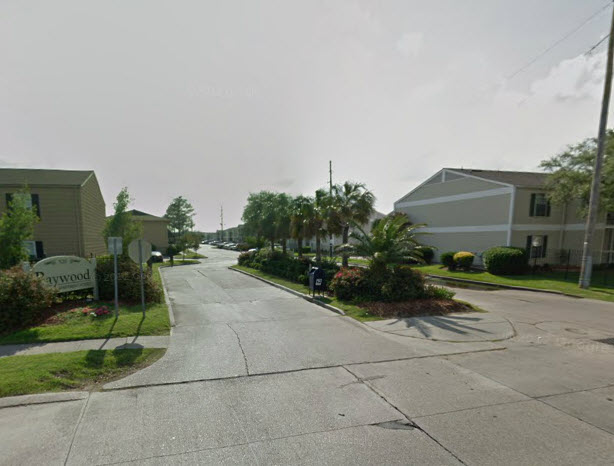
![]() The West Bank was not affected by Hurricane Katrina, except that the population increased dramatically there and apartment occupancy skyrocketed. One beneficiary was 94 percent occupied Baywood Apartments, previously Carlyle Apartments, which was sold last month for $18,000,000. The buyer was not local, a real estate investment company in California called Delta Alliance, founded by Robert Warren with a typical started at the bottom pedigree:
The West Bank was not affected by Hurricane Katrina, except that the population increased dramatically there and apartment occupancy skyrocketed. One beneficiary was 94 percent occupied Baywood Apartments, previously Carlyle Apartments, which was sold last month for $18,000,000. The buyer was not local, a real estate investment company in California called Delta Alliance, founded by Robert Warren with a typical started at the bottom pedigree:
President of Investor Property Services (IPS), a 30 year old property management firm based in Orange County California. Through IPS, Warren has personally supervised a multi-million dollar property portfolio including such diversified assets as multifamily, office complex, shopping center, condominium association, medical office, assisted living and hotel/motel businesses with an emphasis on non-performing assets owned or controlled by financial institutions, state court receiverships, and bankruptcy court authorities. Warren has acted a superior court receiver for income property in a variety of states and possesses a proven ability to analyze, operate and turnaround underperforming assets. Mr. Warren is a Certified Property Manager (CPM®) through the prominent and renowned industry organization, the Institute of Real Estate Management. Warren has taught property management at California State Polytechnic University was the 2005 co-chair of the Los Angeles/Orange County chapter of the California Receiver’s Forum and is the 2003 past president of the Institute of Real Estate Management Orange County Chapter #91.Mr. Warren holds a BA in Economics and a Master’s in Business Administration.
Delta has 20,000 units under management and 2.5 million square feet of commercial space in nine states.

Baywood Apartments Sell For $18 Million
The site, shown above in red outline, is 288 units on 12 acres with 242,000 net rentable area, with rents on one bedrooms at $730 per month and $930 on two bedrooms. Built in 1984 with 535 parking spaces and 26 separate buildings, the gated community has pools, exercise rooms, central A/C and poor reviews on Google from tenants. Estimated rental income is $2.5 million with 50% expenses resulting in a forecasted $1.25 million NOI, which means the cap rate was 6.94%. For a detailed description of how New Orleans commercial real estate is value based on cash flow, see our article at https://louisianacommercialrealty.com/2012/04/how-to-value-commercial-real-estate/.
Baywood-288 units
Copyright, wwwlouisianacommercialrealty.com.
Sources: deedfax, court records, http://www.deltaacmllc.com/pressreleases.aspx
Drugs are a big money business. Especially legal drug stores like Walgreens. Who else could justify paying $94 per square foot for land and a beautiful building only to demolish the building? That's New Orleans commercial real estate at work utilizing the principal of highest and best use. The result is the most profitable businesses can make it feasible to acquire the best locations, driving the price to new market levels. Here is a secret to successful commercial real estate investing in New Orleans: the market value is based on the value of the business operating at that location, not on the previous sales of nearby property which is how most banks loan money-based on appraisal values.
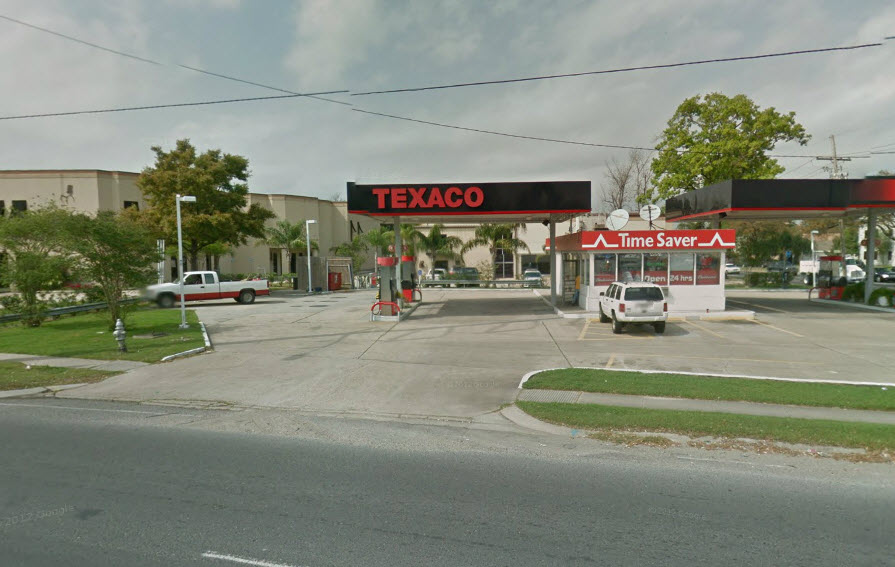
scandinavia site sells for $6.975mm
Walgreens Louisiana purchased the 63,000 square foot L-shaped site for $6 million from Hans Thomsen and Patsy Monk last month and didn't even get the corner 15,000 square foot Texaco site with it, which was purchased separately for $975,000. For other big money New Orleans commercial real estate transactions, see the latest report at https://louisianacommercialrealty.com/2013/03/big-money-new-orleans-commercial-real-estate-transactions-2013/.
The demographics are that good and the population count within a 5 minute drive time is not extraordinary, but the traffic count is between 40,000 and 60,000 cars per day at the intersection, shown below with the site outlined in red.

4513 Airline Highway-Future Walgreens
To find the traffic count for strategic locations in the state, go to http://www.dotd.la.gov/highways/tatv/default.asp. You can select the parish and a list of locations for a traffic count by year, updated to 2011. It is the most accurate database.
Copyright, www.louisanacommercialrealty.com; LOTD